内存
Asked on 2025-06-17
3 searches
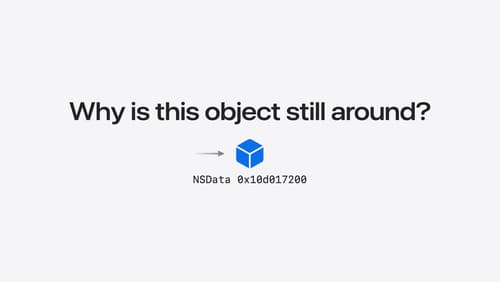
The topic of memory, specifically heap memory, was extensively covered in the session titled "Analyze heap memory" at WWDC 2024. This session focused on understanding and optimizing heap memory usage in applications. Key topics included measuring heap memory, dealing with transient and persistent growth, fixing memory leaks, and improving runtime performance. The session also discussed tools available in Xcode for inspecting heap memory issues, such as the memory graph debugger and Malloc stack logging.
For more detailed insights, you can refer to the following chapters from the session "Analyze heap memory":
- Heap memory overview
- Tools for inspecting heap memory issues
- Transient memory growth overview
- Persistent memory growth overview
- How the Xcode memory graph debugger works
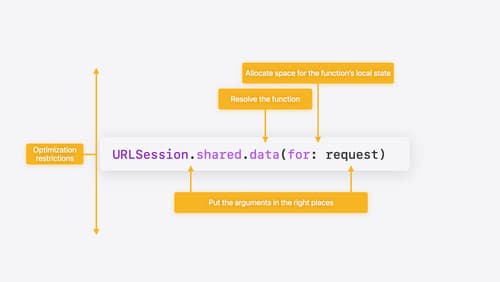
Additionally, the session "Explore Swift performance" also touched on memory allocation and management in Swift, discussing the different types of memory and their implications for performance. You can explore more about memory allocation in Swift in the chapter Memory allocation from this session.

Analyze heap memory
Dive into the basis for your app’s dynamic memory: the heap! Explore how to use Instruments and Xcode to measure, analyze, and fix common heap issues. We’ll also cover some techniques and best practices for diagnosing transient growth, persistent growth, and leaks in your app.

Explore Swift performance
Discover how Swift balances abstraction and performance. Learn what elements of performance to consider and how the Swift optimizer affects them. Explore the different features of Swift and how they’re implemented to further understand the tradeoffs available that can impact performance.
