如何检查卡断
Asked on 2025-10-15
1 search
To check for hangs or stalls in your application, you can use several tools and techniques presented at WWDC:
-
Xcode's Built-in Tools: Use Xcode's built-in CPU gauge to detect if CPUs are heavily used while interacting with your app. For issues impacting the UI or your app's main thread, use the specialized Hangs instrument. This is discussed in the session Optimize CPU performance with Instruments.
-
Thread Performance Checker: Xcode's Thread Performance Checker can help identify threading issues like priority inversions and non-UI work on the main thread. This tool is part of the new features in Xcode, as mentioned in the session What’s new in Xcode.
-
Debugging with LLDB: When debugging an issue with a program, you can use LLDB to inspect the state of the program at different points in time. This can help identify where the program is hanging. The session Run, Break, Inspect: Explore effective debugging in LLDB provides insights into effective debugging techniques.
These tools and techniques can help you diagnose and resolve hangs or stalls in your application.

Xcode essentials
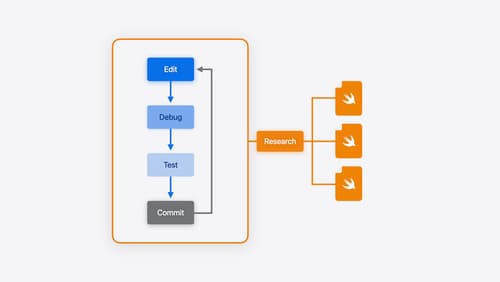
Edit, debug, commit, repeat. Explore the suite of tools in Xcode that help you iterate quickly when developing apps. Discover tips and tricks to help optimize and boost your development workflow.

Optimize CPU performance with Instruments
Learn how to optimize your app for Apple silicon with two new hardware-assisted tools in Instruments. We’ll start by covering how to profile your app, then dive deeper by showing every single function called with Processor Trace. We’ll also discuss how to use CPU Counters’ modes to analyze your code for CPU bottlenecks.

What’s new in Xcode
Discover the latest productivity and performance advancements in Xcode 26. Learn how to leverage large language models in your development workflow. Explore editing and debugging enhancements, improved performance and testing tools, and Swift Build - the open-source build system engine used by Xcode.
