如何检查卡顿
Asked on 2025-10-15
1 search
To check for app performance issues like "卡顿" (hitches or hangs), you can use several tools and techniques discussed in various WWDC sessions:
-
Instruments in Xcode: Instruments is a powerful tool for diagnosing performance issues. You can use it to profile your app and identify bottlenecks. For example, the session Optimize SwiftUI performance with Instruments discusses how to use the SwiftUI instrument to identify long updates that may cause hitches.
-
CPU Performance Optimization: The session Optimize CPU performance with Instruments provides insights into optimizing CPU usage, which can help reduce hangs caused by inefficient code execution.
-
Debugging Techniques: Setting breakpoints effectively can help identify problematic code sections. The session Run, Break, Inspect: Explore effective debugging in LLDB covers how to use breakpoints to debug issues that might lead to performance problems.
-
Concurrency and Main Thread Management: In the session Code-along: Elevate an app with Swift concurrency, it is discussed how to offload tasks to background threads to prevent blocking the main thread, which can cause UI hitches.
By using these tools and techniques, you can effectively diagnose and address performance issues in your app to ensure a smooth user experience.

Xcode essentials
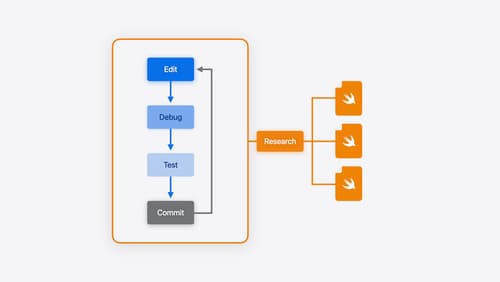
Edit, debug, commit, repeat. Explore the suite of tools in Xcode that help you iterate quickly when developing apps. Discover tips and tricks to help optimize and boost your development workflow.

Optimize SwiftUI performance with Instruments
Discover the new SwiftUI instrument. We’ll cover how SwiftUI updates views, how changes in your app’s data affect those updates, and how the new instrument helps you visualize those causes and effects. To get the most out of this session, we recommend being familiar with writing apps in SwiftUI.

Optimize CPU performance with Instruments
Learn how to optimize your app for Apple silicon with two new hardware-assisted tools in Instruments. We’ll start by covering how to profile your app, then dive deeper by showing every single function called with Processor Trace. We’ll also discuss how to use CPU Counters’ modes to analyze your code for CPU bottlenecks.
