How do I debug a quick look preview extension?
Asked on 2024-07-30
1 search

To debug a Quick Look preview extension, you can follow these steps:
-
Set Up Your Extension: First, create a new target for your Quick Look preview extension. Navigate to the file menu, select "New Target," choose the platform (e.g., macOS), and select the appropriate extension template.
-
Activate and Build: Once the new target is added, activate the extension. Then, select the app's target, go to the product menu, and select "Build" to include the new extension in your app.
-
Attach to Process: Switch back to your extension target. From the debug menu, select "Attach to Process."
-
Use Command Line Utility: Use the
mdutiltool to simulate requests to your bundle ID for debugging. This allows you to run the utility command and then return to Xcode to see if you hit the breakpoint. -
Set Breakpoints: Set breakpoints in your code where you want to debug. For example, you might set a breakpoint in the
reindexAllmethod to catch this point in the code. -
Inspect Variables: Use the variable viewer or hover over variables in the source code to inspect them. Some types even have a Quick Look button providing additional details for the variable.
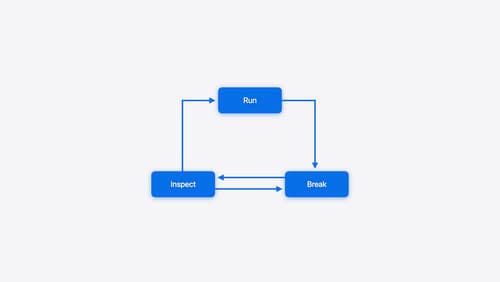
For more detailed guidance on debugging techniques, you can refer to the session Run, Break, Inspect: Explore effective debugging in LLDB (21:05).
Relevant Sessions
What’s new in privacy
At Apple, we believe privacy is a fundamental human right. Learn about new and improved permission flows and other features that manage data in a privacy-preserving way, so that you can focus on creating great app experiences.
Run, Break, Inspect: Explore effective debugging in LLDB
Learn how to use LLDB to explore and debug codebases. We’ll show you how to make the most of crashlogs and backtraces, and how to supercharge breakpoints with actions and complex stop conditions. We’ll also explore how the “p” command and the latest features in Swift 6 can enhance your debugging experience.
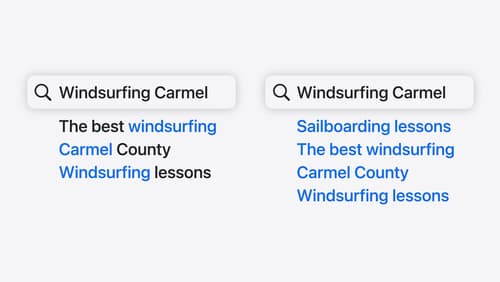
Support semantic search with Core Spotlight
Learn how to provide semantic search results in your app using Core Spotlight. Understand how to make your app’s content available in the user’s private, on-device index so people can search for items using natural language. We’ll also share how to optimize your app’s performance by scheduling indexing activities. To get the most out of this session, we recommend first checking out Core Spotlight documentation on the Apple Developer website.