What is the most efficient way to draw the chart in iOS UI?
Asked on 2024-07-30
1 search

The most efficient way to draw charts in iOS UI is by using the new vectorized plot API in Swift Charts. This API allows Swift Charts to process larger collections of data more efficiently by styling the entire collection of data points homogeneously. Here are some key points to consider:
-
Homogeneous Styling: Use the same element properties for x, y, foreground style, and other visual attributes across the entire dataset. This reduces the need for individual customizations and makes rendering more efficient.
-
Vectorized Plots: For larger datasets, use vectorized plots like rectangle plots. These are optimized for performance and can handle large amounts of data more efficiently than individual mark customizations.
-
Avoid Computations During Rendering: Convert computed properties to stored properties to avoid unnecessary computations during rendering. This can significantly improve performance.
-
Group Data by Style: Group your data by the style you use for them to reduce the number of style alternations Swift Charts has to process.
-
Skip Unnoticeable Customizations: For large datasets, some style customizations may be unnoticeable. Skipping these can make your chart even more performant.
For more detailed information, you can refer to the session Swift Charts: Vectorized and function plots at the timestamp 11:29.
Relevant Sessions

Get started with HealthKit in visionOS
Discover how to use HealthKit to create experiences that take full advantage of the spatial canvas. Learn the capabilities of HealthKit on the platform, find out how to bring an existing iPadOS app to visionOS, and explore the special considerations governing HealthKit during a Guest User session. You’ll also learn ways to use SwiftUI, Swift Charts, and Swift concurrency to craft innovative experiences with HealthKit.
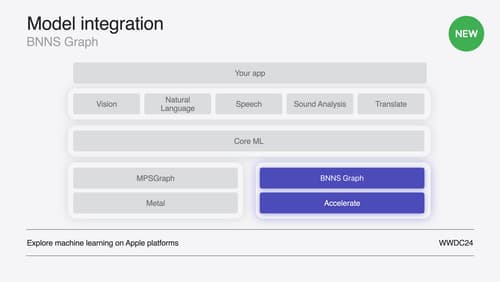
Support real-time ML inference on the CPU
Discover how you can use BNNSGraph to accelerate the execution of your machine learning model on the CPU. We will show you how to use BNNSGraph to compile and execute a machine learning model on the CPU and share how it provides real-time guarantees such as no runtime memory allocation and single-threaded running for audio or signal processing models.

Swift Charts: Vectorized and function plots
The plot thickens! Learn how to render beautiful charts representing math functions and extensive datasets using function and vectorized plots in your app. Whether you’re looking to display functions common in aerodynamics, magnetism, and higher order field theory, or create large interactive heat maps, Swift Charts has you covered.