Performance Issues
Asked on 2024-07-31
1 search

Performance issues in Swift can be multifaceted and often require a combination of high-level and low-level approaches to diagnose and resolve. Here are some key points and tools discussed at WWDC that can help address performance issues:
-
Understanding Performance:
- Performance is multidimensional and situational. It often involves macroscopic problems like high power consumption, slow UI, or frequent app terminations. Tools like Instruments can help identify where to dig in (Explore Swift performance).
-
Low-Level Performance Considerations:
- Low-level performance issues can be dominated by factors such as inefficient function calls, poor data representation, excessive memory allocation, and unnecessary copying and destroying of values. Swift's powerful optimizer can help, but the way you write code significantly impacts optimization potential (Explore Swift performance).
-
Tools and Techniques:
- Thread Performance Checker: This tool in Xcode helps identify runtime issues by pinpointing the exact line of code causing performance problems (What’s new in Xcode 16).
- Flame Graph: A new feature in Instruments 16 that provides a high-level overview of trace execution, helping to spot issues at a glance (What’s new in Xcode 16).
- Heap Memory Analysis: Profiling tools can help identify expensive struct copies and other memory-related performance issues. Whole module optimization and explicit specialization of generics can reduce overhead (Analyze heap memory).
-
Practical Examples:
- Debugging with Xcode: Setting breakpoints and using the unified backtrace view can help trace the source of performance issues (What’s new in Xcode 16).
- Optimizing 3D Assets: For applications involving 3D assets, optimizing the polygon count and texture use is crucial, especially for immersive scenes on devices like Apple Vision Pro (Optimize your 3D assets for spatial computing).
Relevant Sessions
- Explore Swift performance
- What’s new in Xcode 16
- Analyze heap memory
- Optimize your 3D assets for spatial computing
By leveraging these tools and techniques, you can systematically identify and address performance issues in your Swift applications.
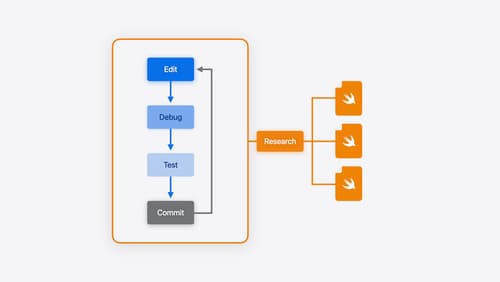
Xcode essentials
Edit, debug, commit, repeat. Explore the suite of tools in Xcode that help you iterate quickly when developing apps. Discover tips and tricks to help optimize and boost your development workflow.

Optimize your 3D assets for spatial computing
Dive into an end-to-end workflow for optimized 3D asset creation. Discover best practices for optimizing meshes, materials, and textures in your digital content creation tool. Learn how to harness shader graph, baking, and material instances to enhance your 3D scene while optimizing performance. Take advantage of native tools to work more effectively with your assets and improve your app’s performance.
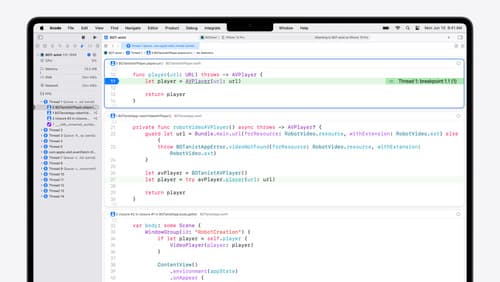
What’s new in Xcode 16
Discover the latest productivity and performance improvements in Xcode 16. Learn about enhancements to code completion, diagnostics, and Xcode Previews. Find out more about updates in builds and explore improvements in debugging and Instruments.