How would I recreate the sleep staging Health app chart in Swift Charts?
Asked on 2024-07-31
1 search

To recreate the sleep staging Health app chart in Swift Charts, you can follow the steps outlined in the session "Swift Charts: Vectorized and function plots." Here’s a general approach to get you started:
-
Define Your Data: First, you need to have your sleep staging data ready. This data typically includes different stages of sleep (e.g., awake, light sleep, deep sleep, REM) over time.
-
Create a Line Plot: Use the line plot API to plot your sleep stages over time. You can customize the appearance of the line plot using various modifiers.
-
Customize the Plot: You can change the color and style of the line plot to differentiate between different sleep stages. You might also want to fill the area under the curve to make the chart more visually appealing.
-
Handle Advanced Functionality: If your sleep data includes more complex patterns, you can use the new function plot API to visualize these. This API allows you to plot mathematical functions and handle piecewise functions, which can be useful if your data has gaps or special conditions.
Here’s a basic example in Swift:
import SwiftUI
import Charts

struct SleepStage: Identifiable {
    let id = UUID()
    let time: Date
    let stage: String
}

struct ContentView: View {
    let sleepData: [SleepStage] = [
        // Populate with your sleep data
    ]

    var body: some View {
        Chart(sleepData) { data in
            LineMark(
                x: .value("Time", data.time),
                y: .value("Stage", data.stage)
            )
            .foregroundStyle(by: .value("Stage", data.stage))
        }
        .chartYScale(domain: ["Awake", "Light Sleep", "Deep Sleep", "REM"])
        .chartXAxis {
            AxisMarks(values: .stride(by: .hour)) // Customize as needed
        }
    }
}
For more detailed guidance, you can refer to the session Swift Charts: Vectorized and function plots which covers how to create and customize function plots, including filling areas under curves and handling advanced plotting scenarios.
Relevant Sessions
These sessions will provide you with the necessary tools and examples to effectively recreate the sleep staging chart in Swift Charts.
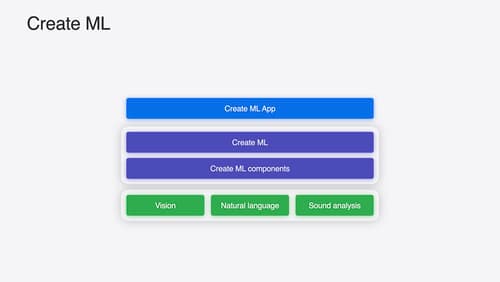
What’s new in Create ML
Explore updates to Create ML, including interactive data source previews and a new template for building object tracking models for visionOS apps. We’ll also cover important framework improvements, including new time-series forecasting and classification APIs.

Get started with HealthKit in visionOS
Discover how to use HealthKit to create experiences that take full advantage of the spatial canvas. Learn the capabilities of HealthKit on the platform, find out how to bring an existing iPadOS app to visionOS, and explore the special considerations governing HealthKit during a Guest User session. You’ll also learn ways to use SwiftUI, Swift Charts, and Swift concurrency to craft innovative experiences with HealthKit.
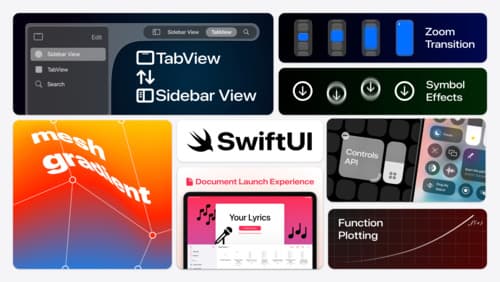
What’s new in SwiftUI
Learn how you can use SwiftUI to build great apps for any Apple platform. Explore a fresh new look and feel for tabs and documents on iPadOS. Improve your window management with new windowing APIs, and gain more control over immersive spaces and volumes in your visionOS apps. We’ll also take you through other exciting refinements that help you make expressive charts, customize and layout text, and so much more.