why
Asked on 2024-07-31
1 search
Debugging in RealityKit and LLDB
RealityKit Debugger
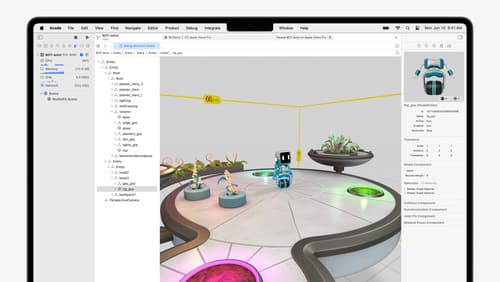
In the session Break into the RealityKit debugger, the RealityKit debugger is introduced as a powerful tool for visualizing and debugging complex entity-component systems. Here are some key points:
- Custom Debug Visualizations: You can add basic model entities to visualize invisible components like attractors in a dance system. Custom components can store values to be presented in the inspector, such as the attractor state.
- Debugging Entity Hierarchies: By inspecting the components of entities, you can identify issues such as a robot not moving towards attractors because it still has a "newcomer" component that should have been removed.
- Fixing Bugs: Once the problem is identified, you can modify the code to remove the problematic component and rerun the app to verify the fix.
LLDB Debugging Techniques
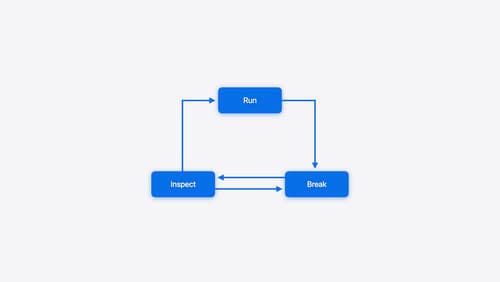
In the session Run, Break, Inspect: Explore effective debugging in LLDB, several advanced debugging techniques are discussed:
- Using Backtraces: Backtraces help understand the control flow of the program and can be combined with crash logs to identify the cause of crashes.
- Breakpoint Conditions: For high-firing breakpoints, you can set conditions to break only when specific criteria are met, such as breaking only when a video is very long.
- The
pCommand: Thepcommand in Xcode 15 has been reworked to combine multiple tools under a single command, making it easier to inspect variables or evaluate expressions.
Xcode Debugging Essentials
In the session Xcode essentials, various debugging features in Xcode are highlighted:
- Breakpoints: You can add breakpoints by clicking on a line number. For high-traffic code, you can use techniques like conditional breakpoints or disabling breakpoints temporarily to isolate issues.
- Using the Console: The console can be used to evaluate expressions and inspect variables during a debugging session.
Relevant Sessions
- Break into the RealityKit debugger
- Run, Break, Inspect: Explore effective debugging in LLDB
- Xcode essentials
These sessions provide a comprehensive overview of debugging techniques in RealityKit and LLDB, as well as essential debugging features in Xcode.

Break into the RealityKit debugger
Meet the RealityKit debugger and discover how this new tool lets you inspect the entity hierarchy of spatial apps, debug rogue transformations, find missing entities, and detect which parts of your code are causing problems for your systems.

Run, Break, Inspect: Explore effective debugging in LLDB
Learn how to use LLDB to explore and debug codebases. We’ll show you how to make the most of crashlogs and backtraces, and how to supercharge breakpoints with actions and complex stop conditions. We’ll also explore how the “p” command and the latest features in Swift 6 can enhance your debugging experience.

Meet the next generation of CarPlay architecture
Dive into the architecture for the next generation of CarPlay. Learn how your vehicle system works with iPhone to create a single cohesive experience that showcases the best of your car and iPhone. Learn how UI is rendered and composited, and explore ways to configure and customize a special experience for each vehicle model. This session is intended for automakers and system developers interested in the next generation of CarPlay.
