what is lldb in xcode
Asked on 2024-07-31
1 search
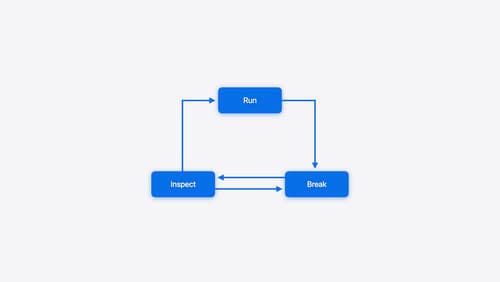
LLDB (Low-Level Debugger) is the underlying debugger that ships with Xcode. It is a powerful tool used for debugging applications, allowing developers to pause their programs at any time, inspect the state of variables, evaluate expressions, and much more. LLDB can be used both through Xcode's graphical user interface and its rich command line interface.
Here are some key features and uses of LLDB in Xcode:
-
Crash Logs: LLDB can consume crash logs and present them in a form that resembles a debugging session, allowing developers to investigate how a crash happened. This can be done by opening a crash log in Xcode, which then uses LLDB to create a debugging session with the state of the program at the time of the crash (Run, Break, Inspect: Explore effective debugging in LLDB).
-
Breakpoints: LLDB allows setting breakpoints to pause program execution at specific lines of code. This helps in inspecting the program state at those points. Breakpoints can be set through Xcode's interface or via LLDB's command line (Run, Break, Inspect: Explore effective debugging in LLDB).
-
Inspecting Variables and Expressions: The
pcommand in LLDB is used to inspect variables and evaluate expressions. This command is essential for understanding the state of the program during debugging (Run, Break, Inspect: Explore effective debugging in LLDB). -
Command Line Interface: LLDB provides a comprehensive command line interface that can be used to perform various debugging tasks, such as setting breakpoints, inspecting variables, and continuing program execution (Run, Break, Inspect: Explore effective debugging in LLDB).
-
Help and Documentation: LLDB offers detailed descriptions of its commands through the
helpcommand. Theaproposcommand can be used to search LLDB's help text for keywords, making it easier to discover relevant commands and options (Run, Break, Inspect: Explore effective debugging in LLDB).
For a deeper dive into LLDB and its features, you can watch the session Run, Break, Inspect: Explore effective debugging in LLDB from WWDC 2024.

Run, Break, Inspect: Explore effective debugging in LLDB
Learn how to use LLDB to explore and debug codebases. We’ll show you how to make the most of crashlogs and backtraces, and how to supercharge breakpoints with actions and complex stop conditions. We’ll also explore how the “p” command and the latest features in Swift 6 can enhance your debugging experience.

Xcode essentials
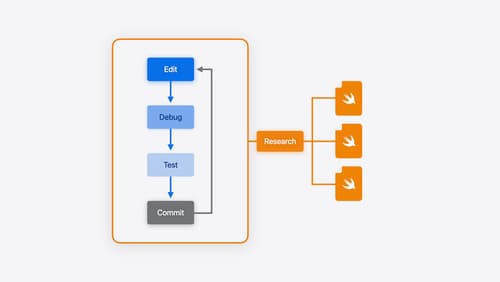
Edit, debug, commit, repeat. Explore the suite of tools in Xcode that help you iterate quickly when developing apps. Discover tips and tricks to help optimize and boost your development workflow.
