where can located the dsym file
Asked on 2024-07-31
1 search

To locate the dSYM file, you need to ensure that the dSYM bundle for the build is available. This is crucial for getting correct line number information with crash logs. The dSYM file is typically generated during the build process and can be found in the build output directory of your project.
For more detailed information on handling dSYM bundles, you can refer to the session "Run, Break, Inspect: Explore effective debugging in LLDB" from WWDC 2024. This session covers the importance of having the dSYM bundle available for symbolication and debugging purposes.
Here are the relevant sessions mentioned in the context:
For more information on debugging and handling crash logs, you can check out the chapters on "Crashlogs & starting the program" and "Breakpoints" in the "Run, Break, Inspect: Explore effective debugging in LLDB" session.
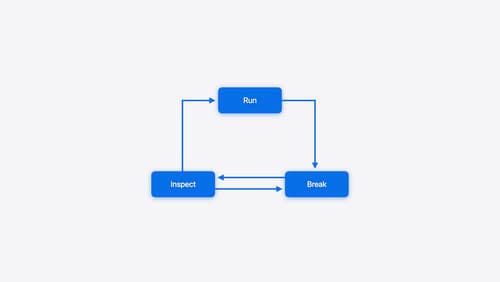
Run, Break, Inspect: Explore effective debugging in LLDB
Learn how to use LLDB to explore and debug codebases. We’ll show you how to make the most of crashlogs and backtraces, and how to supercharge breakpoints with actions and complex stop conditions. We’ll also explore how the “p” command and the latest features in Swift 6 can enhance your debugging experience.
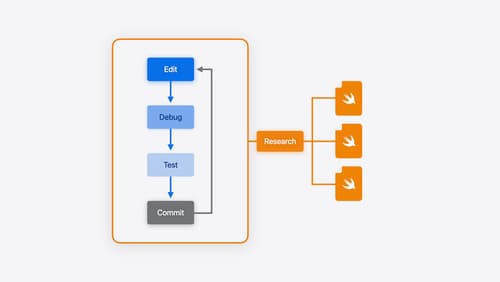
Xcode essentials
Edit, debug, commit, repeat. Explore the suite of tools in Xcode that help you iterate quickly when developing apps. Discover tips and tricks to help optimize and boost your development workflow.
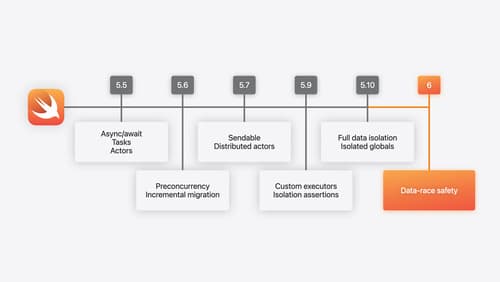
What’s new in Swift
Join us for an update on Swift. We’ll briefly go through a history of Swift over the past decade, and show you how the community has grown through workgroups, expanded the package ecosystem, and increased platform support. We’ll introduce you to a new language mode that achieves data-race safety by default, and a language subset that lets you run Swift on highly constrained systems. We’ll also explore some language updates including noncopyable types, typed throws, and improved C++ interoperability.