How do I use time profiler?
Asked on 2024-08-02
1 search

To use the Time Profiler in Xcode, follow these steps:
- Access Instruments: You can access Instruments from the profile action right within Xcode.
- Record a Trace: Start by recording a trace of your app's launch using the Time Profiler instrument. This instrument visualizes CPU usage in your code and allows you to measure how long different parts of your code are taking to run.
- Analyze the Trace: Once you have a trace, you can analyze it to identify performance issues. For example, you can set the inspection range to a specific interval where you noticed a hang or high CPU usage.
- Use the Flame Graph: Instruments 16 introduces a new flame graph feature, which you can activate from the jump bar. The flame graph provides a high-level overview of the trace execution, allowing you to spot issues at a glance. Execution intervals are weighted by the percentage of time they took in the trace, and the intervals are sorted left to right.
- Identify and Fix Issues: By examining the flame graph, you can identify functions that are taking up a lot of execution time. For instance, if you notice a function being called serially on the main thread, you might want to parallelize the loading using a task group and move the execution to the background.
For a detailed walkthrough, you can refer to the session "What’s new in Xcode 16" starting at 19:44.
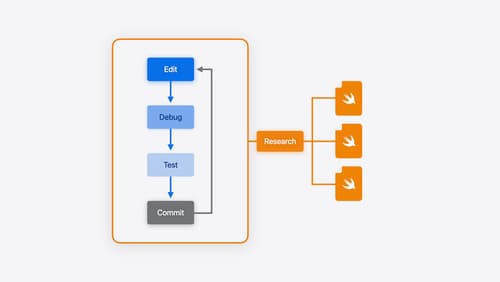
Xcode essentials
Edit, debug, commit, repeat. Explore the suite of tools in Xcode that help you iterate quickly when developing apps. Discover tips and tricks to help optimize and boost your development workflow.

Port advanced games to Apple platforms
Discover how simple it can be to reach players on Apple platforms worldwide. We’ll show you how to evaluate your Windows executable on Apple silicon, start your game port with code samples, convert your shader code to Metal, and bring your game to Mac, iPhone, and iPad. Explore enhanced Metal tools that understand HLSL shaders to validate, debug, and profile your ported shaders on Metal.
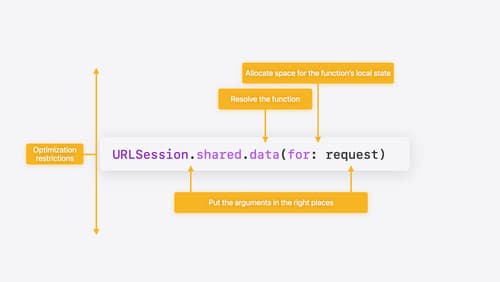
Explore Swift performance
Discover how Swift balances abstraction and performance. Learn what elements of performance to consider and how the Swift optimizer affects them. Explore the different features of Swift and how they’re implemented to further understand the tradeoffs available that can impact performance.