apis for math notes
Asked on 2024-08-02
1 search
For APIs related to math notes, you should look into the session titled "Swift Charts: Vectorized and function plots". This session introduces new capabilities in Swift Charts, including the ability to plot mathematical functions. Here are some key points from the session:
- Function Plots: Swift Charts now allows you to visualize mathematical functions in your apps. This includes both simple and advanced function plots, such as plotting the area under a curve or between two functions.
- Parametric Functions: You can graph parametric functions where x and y are defined in terms of a third variable, t.
- Piecewise Functions: Swift Charts supports handling piecewise functions, including cases where certain values in the domain do not have an output.
For more detailed information, you can refer to the following chapters and timestamps from the session:
- Function plots: Swift Charts: Vectorized and function plots (00:01:01)
- Advanced function plots: Swift Charts: Vectorized and function plots (00:04:08)
These sections will provide you with a comprehensive overview of how to use Swift Charts for visualizing mathematical functions in your applications.

Support real-time ML inference on the CPU
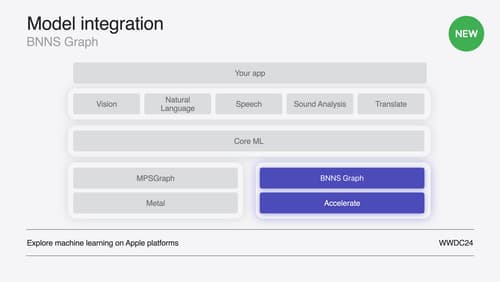
Discover how you can use BNNSGraph to accelerate the execution of your machine learning model on the CPU. We will show you how to use BNNSGraph to compile and execute a machine learning model on the CPU and share how it provides real-time guarantees such as no runtime memory allocation and single-threaded running for audio or signal processing models.

Swift Charts: Vectorized and function plots
The plot thickens! Learn how to render beautiful charts representing math functions and extensive datasets using function and vectorized plots in your app. Whether you’re looking to display functions common in aerodynamics, magnetism, and higher order field theory, or create large interactive heat maps, Swift Charts has you covered.
