How to use cluster in map in swiftui?
Asked on 2024-08-02
1 search

To use clustering in maps with SwiftUI, you can refer to the session "Unlock the power of places with MapKit" from WWDC 2024. This session covers various aspects of MapKit, including how to display place details and use selection accessories for map features.
For a detailed explanation, you can start with the chapter on Display place details in the session "Unlock the power of places with MapKit". This section will guide you through the process of displaying information on a map, which is a fundamental step before implementing clustering.
Here is the ordered list of sessions mentioned in the context:
- Unlock the power of places with MapKit
- What’s new in SwiftUI
- Swift Charts: Vectorized and function plots
- Build a spatial drawing app with RealityKit
- What’s new in SwiftData
- Create custom visual effects with SwiftUI
- Get started with HealthKit in visionOS
If you need more specific details or code examples, please let me know!

Unlock the power of places with MapKit
Discover powerful new ways to integrate maps into your apps and websites with MapKit and MapKit JS. Learn how to save and reference unique places using Place ID. Check out improvements to search that make it more efficient to find relevant places. Get introduced to the new Place Card API that lets you display rich information about places so customers can explore destinations right in your app. And, we’ll show you quick ways to embed maps in your website with our simplified token provisioning and Web Embed API.
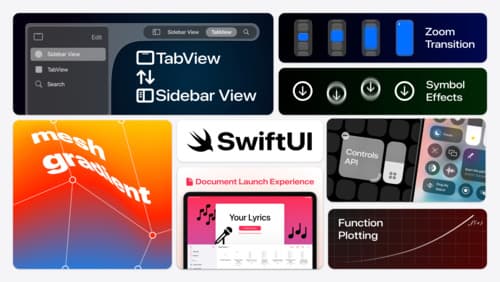
What’s new in SwiftUI
Learn how you can use SwiftUI to build great apps for any Apple platform. Explore a fresh new look and feel for tabs and documents on iPadOS. Improve your window management with new windowing APIs, and gain more control over immersive spaces and volumes in your visionOS apps. We’ll also take you through other exciting refinements that help you make expressive charts, customize and layout text, and so much more.
Swift Charts: Vectorized and function plots
The plot thickens! Learn how to render beautiful charts representing math functions and extensive datasets using function and vectorized plots in your app. Whether you’re looking to display functions common in aerodynamics, magnetism, and higher order field theory, or create large interactive heat maps, Swift Charts has you covered.