How to analysis crash
Asked on 2024-08-02
1 search

To analyze a crash, you can follow these steps using LLDB and Xcode, as discussed in the session Run, Break, Inspect: Explore effective debugging in LLDB:
-
Open the Crash Log:
- You can open a crash log by secondary clicking the file and selecting to open it with Xcode. Xcode will ask if you want to open the file in the context of a project. Choose the relevant project to create a debugging session with the state of the program at the time of the crash.
-
Inspect the Crash Log:
- The crash log will highlight the line where the crash occurred. This can give you an immediate clue about what went wrong. For example, it might show that the code is failing to open a JSON file.
-
Use Backtrace:
- The backtrace tool in the debug navigator of Xcode can help you understand the sequence of function calls that led to the crash. This provides insight into what each function was doing and where they were called from.
-
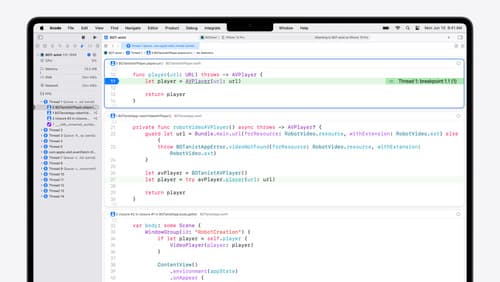
Set Breakpoints:
- Set a breakpoint right before the function where the crash occurred. This allows you to inspect the state of the program just before the crash. You can do this by secondary clicking the log message to navigate to the corresponding source code location and setting a breakpoint there.
-
Inspect Variables:
- Use the variable viewer or hover over variables in the source code to inspect their values. Some types even have a quick look button for additional details.
-
Reproduce the Bug:
- If necessary, relaunch the program to reproduce the bug and inspect the state at different points in time. This helps in narrowing down the problematic code.
For more detailed steps and examples, you can refer to the session Run, Break, Inspect: Explore effective debugging in LLDB.
Relevant Sessions
- Run, Break, Inspect: Explore effective debugging in LLDB
- What’s new in Xcode 16 (for debugging tools and techniques)
- Analyze heap memory (for memory-related issues)
These sessions provide comprehensive insights into debugging techniques and tools available in Xcode and LLDB.
What’s new in Xcode 16
Discover the latest productivity and performance improvements in Xcode 16. Learn about enhancements to code completion, diagnostics, and Xcode Previews. Find out more about updates in builds and explore improvements in debugging and Instruments.
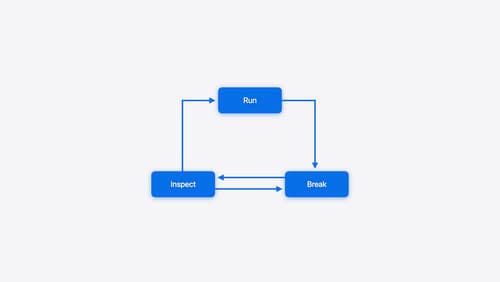
Run, Break, Inspect: Explore effective debugging in LLDB
Learn how to use LLDB to explore and debug codebases. We’ll show you how to make the most of crashlogs and backtraces, and how to supercharge breakpoints with actions and complex stop conditions. We’ll also explore how the “p” command and the latest features in Swift 6 can enhance your debugging experience.

Analyze heap memory
Dive into the basis for your app’s dynamic memory: the heap! Explore how to use Instruments and Xcode to measure, analyze, and fix common heap issues. We’ll also cover some techniques and best practices for diagnosing transient growth, persistent growth, and leaks in your app.