What’s the best way to catch a crash
Asked on 2024-08-03
1 search

To effectively catch and diagnose a crash, you can follow these steps as outlined in the WWDC sessions:
-
Reproduce the Bug: The first step in debugging is being able to reproduce the bug. This can be done by running the application under the debugger. You can start by hitting the start button in Xcode or launching LLDB through the command line using the target executable and its arguments. Run, Break, Inspect: Explore effective debugging in LLDB.
-
Use Crash Logs: When a program crashes, a crash log is created which contains information about the state of the program at the time of the crash. LLDB can consume these crash logs and present them in a form that resembles a debugging session. This allows you to perform an initial investigation into how the crash happened. Run, Break, Inspect: Explore effective debugging in LLDB.
-
Inspect the Backtrace: The backtrace describes the sequence of function calls or stack frames that led to the program state at the time of the crash. It provides a view into what each function was doing, where they were called, and where each of them was going to return to. This can help you understand the control flow of the program and identify the source of the crash. Run, Break, Inspect: Explore effective debugging in LLDB.
-
Set Breakpoints: You can set breakpoints to stop the program execution at specific lines of code. This allows you to inspect the state of the program at those points. If the breakpoint would be hit too frequently, you can use techniques like conditional breakpoints or using two breakpoints in tandem to isolate the problematic invocation. Xcode essentials.
-
Use Swift Error Breakpoints: If your application is unexpectedly failing with a thrown Swift error, you can add a Swift error breakpoint in the breakpoint's navigator. This will stop the app immediately where any error is thrown, helping you to find the origin of the error. Xcode essentials.
-
Utilize the Unified Backtrace View: In Xcode 16, you can enable the unified backtrace view from the debug bar. This new visualization allows you to follow the call stack and view the surrounding code in each frame simply by scrolling down. This can make it easier to trace where a call is coming from and understand the context of the crash. What’s new in Xcode 16.
By following these steps, you can effectively catch and diagnose crashes in your application.
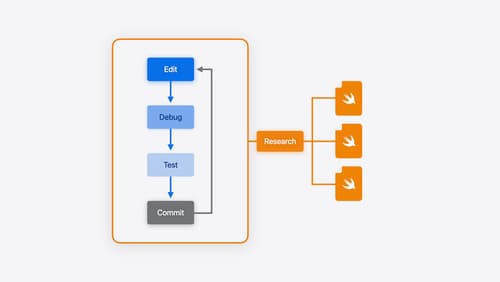
Xcode essentials
Edit, debug, commit, repeat. Explore the suite of tools in Xcode that help you iterate quickly when developing apps. Discover tips and tricks to help optimize and boost your development workflow.
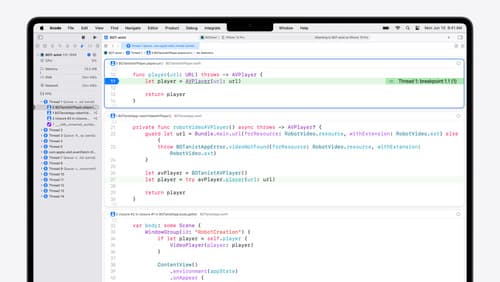
What’s new in Xcode 16
Discover the latest productivity and performance improvements in Xcode 16. Learn about enhancements to code completion, diagnostics, and Xcode Previews. Find out more about updates in builds and explore improvements in debugging and Instruments.
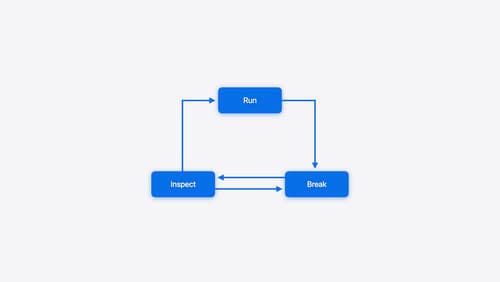
Run, Break, Inspect: Explore effective debugging in LLDB
Learn how to use LLDB to explore and debug codebases. We’ll show you how to make the most of crashlogs and backtraces, and how to supercharge breakpoints with actions and complex stop conditions. We’ll also explore how the “p” command and the latest features in Swift 6 can enhance your debugging experience.