logging
Asked on 2024-08-05
2 searches
Logging in the Context of WWDC
Logging is a crucial aspect of observability and debugging, as highlighted in several sessions at WWDC. Here are some key points and sessions that discuss logging:
-
Explore the Swift on Server ecosystem
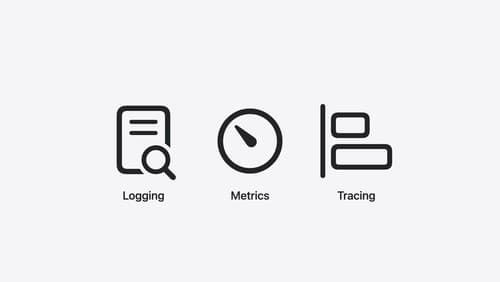
- Logging, Metrics, and Tracing: This session emphasizes the importance of logging as part of observability, which also includes metrics and tracing. Logging helps understand what a service did and aids in troubleshooting problems. SwiftLog supports structured logging by adding metadata to log messages, providing additional context when troubleshooting problems.
- Backend Agnostic: The Swift on Server ecosystem supports various backends for logging, metrics, and distributed tracing. The choice of backend is left to the service author, and bootstrapping should be done early to ensure no observability event is lost.
- Example: The session provides an example of using SwiftLog to emit logs when handling requests and troubleshooting errors, such as a duplicate key violation in a database.
-
Use CloudKit Console to monitor and optimize database activity
- Customizable Logs: This session demonstrates how logs in CloudKit Console can be customized to display specific columns, making it easier to compare values between events and identify issues.
- Exporting Logs: Logs can be exported in different formats for historical comparison and external analysis.
Use CloudKit Console to monitor and optimize database activity (07:13)
-
Run, Break, Inspect: Explore effective debugging in LLDB
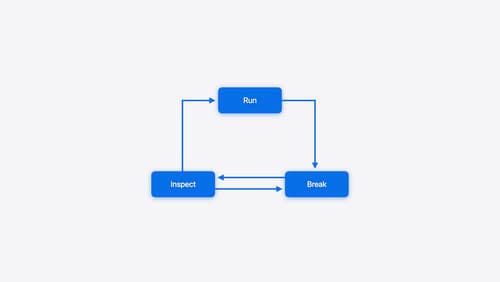
- Log Statements: The session discusses using log statements as a technique to inspect the state of a program. Detailed logs can help pinpoint bugs without needing to recompile the code.
- Navigating Logs: By secondary clicking a log message, developers can quickly navigate to the corresponding source code location, set breakpoints, and inspect variables.
Run, Break, Inspect: Explore effective debugging in LLDB (07:27)
-
Xcode essentials
- OSLog: This session suggests using OSLog instead of print statements for debugging. OSLog provides a debug level for each message and allows filtering by text, message type, and more. It also enables jumping directly to the source line from the log message.
Relevant Sessions
- Explore the Swift on Server ecosystem
- Use CloudKit Console to monitor and optimize database activity
- Run, Break, Inspect: Explore effective debugging in LLDB
- Xcode essentials
These sessions provide a comprehensive overview of how logging can be effectively used for observability and debugging in various contexts.

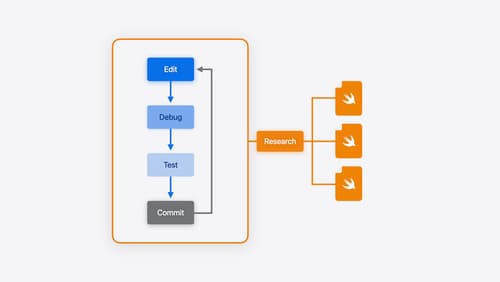
Xcode essentials
Edit, debug, commit, repeat. Explore the suite of tools in Xcode that help you iterate quickly when developing apps. Discover tips and tricks to help optimize and boost your development workflow.

Explore the Swift on Server ecosystem
Swift is a great language for writing your server applications, and powers critical services across Apple’s cloud products. We’ll explore tooling, delve into the Swift server package ecosystem, and demonstrate how to interact with databases and add observability to applications.

Run, Break, Inspect: Explore effective debugging in LLDB
Learn how to use LLDB to explore and debug codebases. We’ll show you how to make the most of crashlogs and backtraces, and how to supercharge breakpoints with actions and complex stop conditions. We’ll also explore how the “p” command and the latest features in Swift 6 can enhance your debugging experience.
