blocking calls
Asked on 2024-08-05
1 search
To handle blocking calls and high-firing breakpoints in Xcode, you can use several techniques to make debugging more efficient. Here are some relevant strategies discussed in the WWDC sessions:
-
Using Conditional Breakpoints:
- You can set a line breakpoint and modify it with a condition to stop the program only when certain criteria are met. This is useful for breakpoints inside loops or frequently called functions.
- Example: If you want to stop at a function only when a specific condition is true, you can set a condition on the breakpoint. This can be done using the
break modifycommand in LLDB or through the breakpoint editor in Xcode. - Run, Break, Inspect: Explore effective debugging in LLDB (16:06)
-
Ignoring Breakpoints for a Fixed Number of Times:
- You can configure a breakpoint to ignore the first few hits and stop only on subsequent hits. This is useful when you want to skip over initial iterations or calls.
- Example: To ignore the first ten hits of a breakpoint, you can set the ignore count flag in Xcode's breakpoint editor.
- Run, Break, Inspect: Explore effective debugging in LLDB (17:57)
-
Auto-Continue Breakpoints:
- Set a breakpoint to automatically continue after hitting it, optionally performing an action like logging. This helps in monitoring without stopping the program.
- Example: You can set an auto-continue breakpoint on a function and create a temporary breakpoint on another function to track specific events.
- Run, Break, Inspect: Explore effective debugging in LLDB (17:57)
-
Using Swift Error Breakpoints:
- Add a Swift error breakpoint to stop the program immediately where any error is thrown, which is useful for debugging unexpected failures.
- Example: If your application throws and catches errors frequently, you can scope the Swift error breakpoint to specific conditions to reduce noise.
- Xcode essentials (18:19)
These techniques can help you manage blocking calls and high-firing breakpoints more effectively, making your debugging process smoother and more targeted.

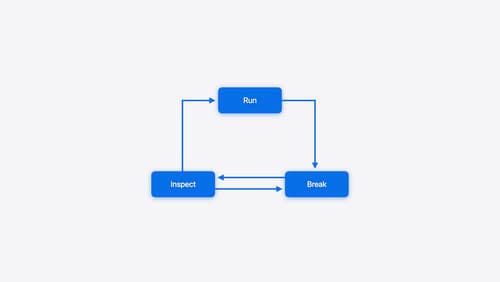
Run, Break, Inspect: Explore effective debugging in LLDB
Learn how to use LLDB to explore and debug codebases. We’ll show you how to make the most of crashlogs and backtraces, and how to supercharge breakpoints with actions and complex stop conditions. We’ll also explore how the “p” command and the latest features in Swift 6 can enhance your debugging experience.

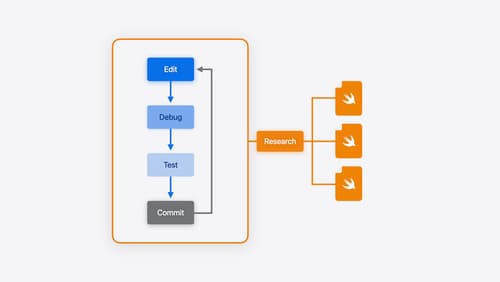
Xcode essentials
Edit, debug, commit, repeat. Explore the suite of tools in Xcode that help you iterate quickly when developing apps. Discover tips and tricks to help optimize and boost your development workflow.

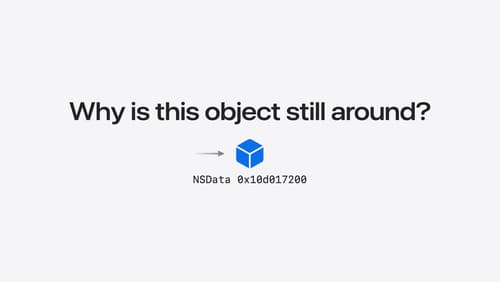
Analyze heap memory
Dive into the basis for your app’s dynamic memory: the heap! Explore how to use Instruments and Xcode to measure, analyze, and fix common heap issues. We’ll also cover some techniques and best practices for diagnosing transient growth, persistent growth, and leaks in your app.
