what can I use to display a graph with vertices
Asked on 2024-08-07
1 search

To display a graph with vertices, you have a couple of options presented at WWDC:
-
NP's Graph Viewer: This tool is part of the Metal Performance Shaders (MPS) framework and allows you to visualize computational graphs. It provides a detailed view of the operations and how they are connected, making it easy to understand the structure and execution of your graph. You can zoom in to see high-level structures and further details, and it supports optimization for specific devices. For more information, you can check out the session Accelerate machine learning with Metal.
-
Swift Charts: If you are looking to visualize data points in a more traditional chart format, Swift Charts offers a variety of plot APIs, including vectorized plots for handling larger datasets efficiently. This can be useful for creating scatterplots, heat maps, and other types of data visualizations. For more details, you can refer to the session Swift Charts: Vectorized and function plots.
Relevant Sessions
These tools should help you effectively display and analyze graphs with vertices.
What’s new in SwiftUI
Learn how you can use SwiftUI to build great apps for any Apple platform. Explore a fresh new look and feel for tabs and documents on iPadOS. Improve your window management with new windowing APIs, and gain more control over immersive spaces and volumes in your visionOS apps. We’ll also take you through other exciting refinements that help you make expressive charts, customize and layout text, and so much more.
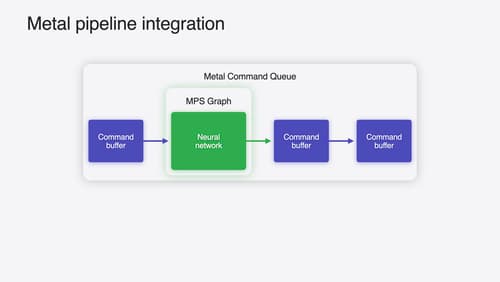
Accelerate machine learning with Metal
Learn how to accelerate your machine learning transformer models with new features in Metal Performance Shaders Graph. We’ll also cover how to improve your model’s compute bandwidth and quality, and visualize it in the all new MPSGraph viewer.
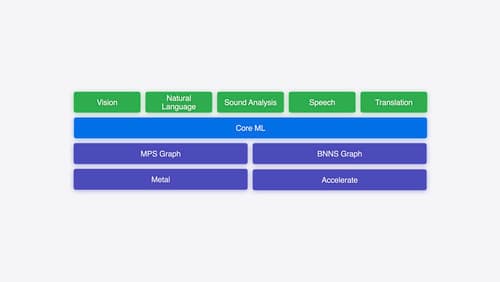
Explore machine learning on Apple platforms
Get started with an overview of machine learning frameworks on Apple platforms. Whether you’re implementing your first ML model, or an ML expert, we’ll offer guidance to help you select the right framework for your app’s needs.