What's the best way to present a pie chart in SwiftUI?
Asked on 2024-08-07
1 search

To present a pie chart in SwiftUI, you can utilize the capabilities of Swift Charts. While the specific context provided does not directly mention pie charts, it does highlight the flexibility and customization options available in Swift Charts, which can be applied to create various types of charts, including pie charts.
For a detailed guide on creating and customizing charts, you can refer to the session Swift Charts: Vectorized and function plots which covers function plots and vectorized plots, providing insights into how you can leverage Swift Charts for different types of data visualizations.
Here are some steps you might follow to create a pie chart in SwiftUI:
- Define Your Data: Create a data model that represents the segments of your pie chart.
- Use Swift Charts: Utilize the
Chartview in SwiftUI to plot your data. - Customize Appearance: Apply modifiers to customize the appearance of your pie chart, such as colors and labels.
For more advanced customization and performance optimization, you can explore the best practices discussed in the session Swift Charts: Vectorized and function plots.
If you are new to Swift Charts, it might be helpful to start with the basics and then move on to more complex customizations.
Swift Charts: Vectorized and function plots
The plot thickens! Learn how to render beautiful charts representing math functions and extensive datasets using function and vectorized plots in your app. Whether you’re looking to display functions common in aerodynamics, magnetism, and higher order field theory, or create large interactive heat maps, Swift Charts has you covered.

Get started with HealthKit in visionOS
Discover how to use HealthKit to create experiences that take full advantage of the spatial canvas. Learn the capabilities of HealthKit on the platform, find out how to bring an existing iPadOS app to visionOS, and explore the special considerations governing HealthKit during a Guest User session. You’ll also learn ways to use SwiftUI, Swift Charts, and Swift concurrency to craft innovative experiences with HealthKit.
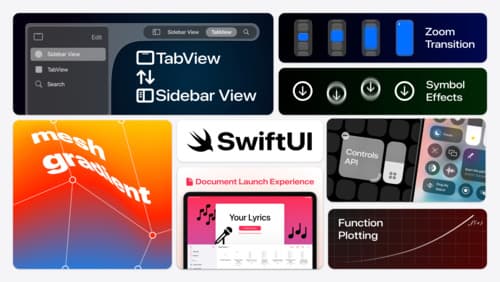
What’s new in SwiftUI
Learn how you can use SwiftUI to build great apps for any Apple platform. Explore a fresh new look and feel for tabs and documents on iPadOS. Improve your window management with new windowing APIs, and gain more control over immersive spaces and volumes in your visionOS apps. We’ll also take you through other exciting refinements that help you make expressive charts, customize and layout text, and so much more.