How to profile application for hangs?
Asked on 2024-08-07
1 search

To profile an application for hangs, you can use the tools provided in Xcode, specifically the Instruments tool. Here are the steps you can follow:
-
Access Instruments: You can access Instruments from the profile action right within Xcode.
-
Use the Time Profiler Instrument: The Time Profiler instrument is particularly useful for visualizing CPU usage in your code and measuring how long different parts of your code take to run. This can help you identify hangs during the app's launch or other operations.
-
Set the Inspection Range: Once you have a trace of your app's launch, you can set the inspection range to the hang interval. This allows you to focus on the portion of the trace where the hang occurs.
-
Analyze the Data: Use the new flame graph feature in Instruments 16, which provides a high-level overview of the trace execution. This can help you narrow down the problem by visualizing which parts of your code are consuming the most CPU.
For more detailed steps and a visual demonstration, you can refer to the session "What’s new in Xcode 16" at the timestamp 18:46.
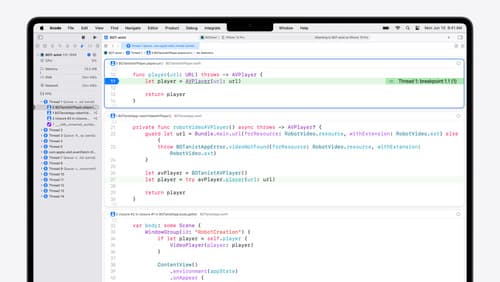
Additionally, the Thread Performance Checker in Xcode can help identify main thread hangs and other performance issues. This tool surfaces runtime issues and pinpoints the exact line of code to focus on, even if the issue isn't reproducing locally.
For more information on using the Thread Performance Checker, you can refer to the session "What’s new in Xcode 16" at the timestamp 10:06.
Relevant Sessions

Analyze heap memory
Dive into the basis for your app’s dynamic memory: the heap! Explore how to use Instruments and Xcode to measure, analyze, and fix common heap issues. We’ll also cover some techniques and best practices for diagnosing transient growth, persistent growth, and leaks in your app.
What’s new in Xcode 16
Discover the latest productivity and performance improvements in Xcode 16. Learn about enhancements to code completion, diagnostics, and Xcode Previews. Find out more about updates in builds and explore improvements in debugging and Instruments.
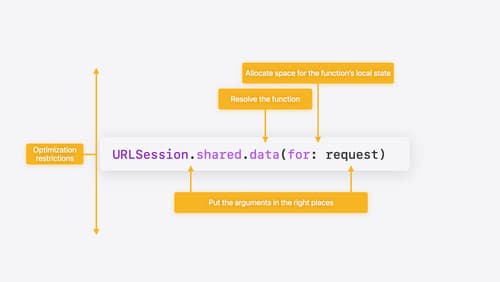
Explore Swift performance
Discover how Swift balances abstraction and performance. Learn what elements of performance to consider and how the Swift optimizer affects them. Explore the different features of Swift and how they’re implemented to further understand the tradeoffs available that can impact performance.