memory management
Asked on 2024-08-08
3 searches
Memory Management at WWDC
Apple's WWDC sessions cover various aspects of memory management, particularly focusing on heap memory and its implications for application performance. Here are some key points from the sessions:
Heap Memory Overview
Heap memory is a critical part of an application's memory footprint. It consists of multiple virtual memory regions, each broken into individual heap allocations. These allocations can be clean, dirty, or swapped:
- Clean pages: Memory that hasn't been written to and can be discarded or faulted again.
- Dirty pages: Memory written to recently and cannot be thrown away easily.
- Swapped pages: Memory that can be compressed or written to disk under memory pressure.
Memory Allocation
Memory allocation is categorized into three types:
- Global memory: Allocated and initialized when the program loads, suitable for global and static variables.
- Stack memory: Cheap and scoped to the function call frames, suitable for local variables.
- Heap memory: Flexible but more expensive due to arbitrary allocation and deallocation times, used for class instances and other dynamic allocations.
Tools for Memory Analysis
Xcode and Instruments provide several tools for analyzing memory usage:
- Malloc stack logging: Records call stacks and timestamps for each allocation, making it easier to track memory usage.
- Instruments: Includes templates like allocations and leaks instruments to record allocation history and detect memory leaks.
Managing Memory Leaks
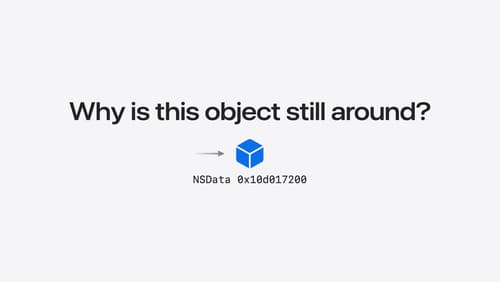
Memory leaks occur when memory is no longer reachable but hasn't been deallocated. Tools like Xcode's memory graph debugger and Malloc stack logging help identify and resolve these leaks.
Performance Implications
Efficient memory management is crucial for application performance. Persistent memory growth and leaks can degrade performance, causing stutters or hangs. Proactive analysis and optimization of heap memory can enhance user experience.
Relevant Sessions
For more detailed insights, you can refer to the specific chapters in these sessions:
-
Analyze heap memory:
- Heap memory overview
- Tools for inspecting heap memory issues
- Managing autorelease pool growth in Swift
- Persistent memory growth overview
- How the Xcode memory graph debugger works
- Reachability and ensuring memory is deallocated appropriately
- Resolving leaks of Swift closure contexts
- Leaks FAQ
- Comparing performance of weak and unowned
- Reducing reference counting overhead
- Cost of measurement
-
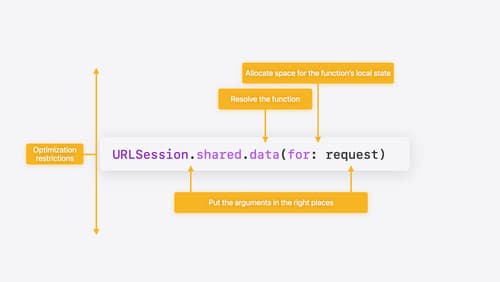
Explore Swift performance:
- Memory allocation
- Memory layout
- Value copying
- Dynamically-sized types
- Async functions
- Closures
- Generics
For specific timestamps, you can refer to the provided links to dive deeper into each topic.

Explore Swift performance
Discover how Swift balances abstraction and performance. Learn what elements of performance to consider and how the Swift optimizer affects them. Explore the different features of Swift and how they’re implemented to further understand the tradeoffs available that can impact performance.

Analyze heap memory
Dive into the basis for your app’s dynamic memory: the heap! Explore how to use Instruments and Xcode to measure, analyze, and fix common heap issues. We’ll also cover some techniques and best practices for diagnosing transient growth, persistent growth, and leaks in your app.
