что нового в SwiftCharts?
Asked on 2024-08-08
1 search

В SwiftCharts на WWDC 2024 были представлены несколько новых возможностей:
-
Функциональные графики:
- Теперь SwiftCharts позволяет визуализировать математические функции в ваших приложениях. Это включает в себя два новых типа графиков: линейный график для визуализации одной функции и график области для заполнения области между двумя функциями.
- Поддержка параметрических функций, где x и y определяются в терминах третьей переменной t.
- Возможность обработки кусочных функций, где для некоторых значений в домене нет выходных данных.
-
Векторизованные графики:
- Новые API для векторизованных графиков, которые поддерживают визуализацию больших наборов данных более эффективно.
- Векторизованные графики позволяют обрабатывать большие коллекции данных, используя одинаковые свойства для всех элементов, что повышает производительность.
-
Доступность:
- SwiftCharts делает ваши графики доступными по умолчанию, поддерживая VoiceOver для описания графиков.
Для более детального изучения новых возможностей, вы можете посмотреть сессию Swift Charts: Vectorized and function plots (00:07).
Упомянутые сессии:
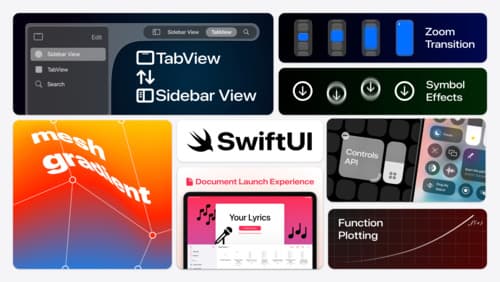
What’s new in SwiftUI
Learn how you can use SwiftUI to build great apps for any Apple platform. Explore a fresh new look and feel for tabs and documents on iPadOS. Improve your window management with new windowing APIs, and gain more control over immersive spaces and volumes in your visionOS apps. We’ll also take you through other exciting refinements that help you make expressive charts, customize and layout text, and so much more.
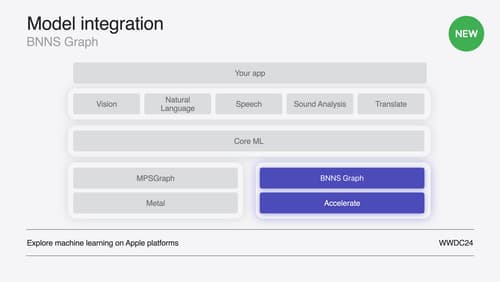
Support real-time ML inference on the CPU
Discover how you can use BNNSGraph to accelerate the execution of your machine learning model on the CPU. We will show you how to use BNNSGraph to compile and execute a machine learning model on the CPU and share how it provides real-time guarantees such as no runtime memory allocation and single-threaded running for audio or signal processing models.

Get started with HealthKit in visionOS
Discover how to use HealthKit to create experiences that take full advantage of the spatial canvas. Learn the capabilities of HealthKit on the platform, find out how to bring an existing iPadOS app to visionOS, and explore the special considerations governing HealthKit during a Guest User session. You’ll also learn ways to use SwiftUI, Swift Charts, and Swift concurrency to craft innovative experiences with HealthKit.