how to od i
Asked on 2024-08-08
1 search

To effectively debug in LLDB, you can use several techniques and commands to inspect and control the execution of your program. Here are some key points and techniques covered in the WWDC sessions:
-
Using the
pCommand:- The
pcommand is a primary tool for inspecting variables and evaluating expressions. It has been reworked in Xcode 15 to be an alias to the "do what I mean" print command, which combines many different tools under a single command. This can save time and simplify the debugging process. For more details, you can refer to the session Run, Break, Inspect: Explore effective debugging in LLDB (19:24).
- The
-
Setting Conditional Breakpoints:
- Conditional breakpoints allow you to stop the program only when certain conditions are met. For example, you can set a breakpoint to stop only if a variable meets a specific condition. This can be done using the
break modifycommand with a condition expression. In Xcode, you can set this by secondary-clicking on the breakpoint, navigating to "Edit Breakpoint," and populating the condition field. More on this can be found in the session Run, Break, Inspect: Explore effective debugging in LLDB (16:05).
- Conditional breakpoints allow you to stop the program only when certain conditions are met. For example, you can set a breakpoint to stop only if a variable meets a specific condition. This can be done using the
-
Handling High-Firing Breakpoints:
- When dealing with breakpoints that are triggered frequently, you can use techniques such as:
- Auto-continue Breakpoints: These breakpoints stop only once at a specified location.
- Ignore Count: This allows you to ignore the breakpoint for a specified number of times before stopping.
- Temporary Breakpoints: These are created to stop only once at a specific location. For example, you can set an auto-continue breakpoint on a function and create a temporary breakpoint on another function. More details are available in the session Run, Break, Inspect: Explore effective debugging in LLDB (17:57).
- When dealing with breakpoints that are triggered frequently, you can use techniques such as:
-
Using Crash Logs:
- LLDB can consume crash logs and present them in a form that resembles a debugging session. This can help you understand the state of the program at the time of the crash without needing to reproduce the issue manually. This technique is discussed in the session Run, Break, Inspect: Explore effective debugging in LLDB (04:07).
-
Breakpoint Actions:
- Breakpoint actions can be used to print variables, create new breakpoints, or execute code while debugging. This allows you to leverage your coding skills without needing to recompile your projects. More on this can be found in the session Run, Break, Inspect: Explore effective debugging in LLDB (12:10).
For a comprehensive understanding of debugging in LLDB, you can refer to the session Run, Break, Inspect: Explore effective debugging in LLDB.
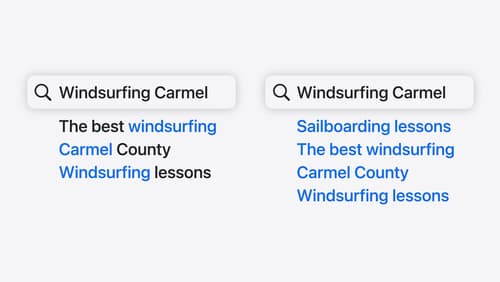
Support semantic search with Core Spotlight
Learn how to provide semantic search results in your app using Core Spotlight. Understand how to make your app’s content available in the user’s private, on-device index so people can search for items using natural language. We’ll also share how to optimize your app’s performance by scheduling indexing activities. To get the most out of this session, we recommend first checking out Core Spotlight documentation on the Apple Developer website.
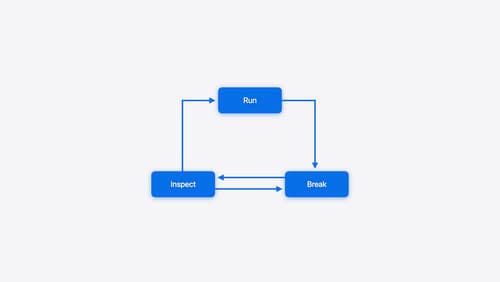
Run, Break, Inspect: Explore effective debugging in LLDB
Learn how to use LLDB to explore and debug codebases. We’ll show you how to make the most of crashlogs and backtraces, and how to supercharge breakpoints with actions and complex stop conditions. We’ll also explore how the “p” command and the latest features in Swift 6 can enhance your debugging experience.
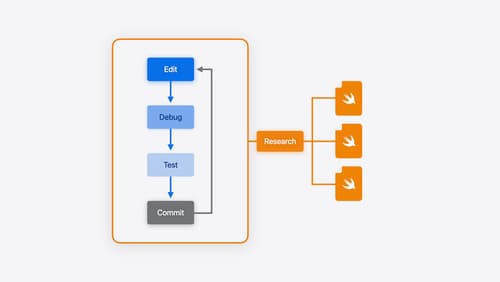
Xcode essentials
Edit, debug, commit, repeat. Explore the suite of tools in Xcode that help you iterate quickly when developing apps. Discover tips and tricks to help optimize and boost your development workflow.