how to gather stacktrace
Asked on 2024-08-12
1 search
To gather a stack trace in Xcode, you can use the backtrace feature in the LLDB debugger. A backtrace provides a sequence of function calls or stack frames that led to the current program state, which is useful for understanding the control flow of the program, especially when dealing with crashes or debugging sessions.
Here's a brief overview of how you can gather a stack trace:
-
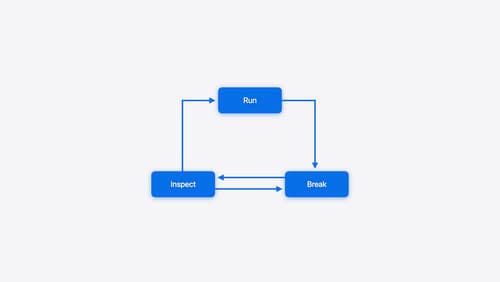
Run the Program: Start by running your application under the debugger in Xcode. You can do this by hitting the start button in Xcode or launching LLDB through the command line.
-
Break at an Interesting Point: Set breakpoints at points in your code where you suspect issues might be occurring. This can be done by clicking in the gutter next to the line numbers in Xcode.
-
Inspect the Program State: Once the program hits a breakpoint, you can inspect the program state. Use the debug navigator in Xcode to view the current backtrace. This will show you the sequence of function calls that led to the current point in the program.
-
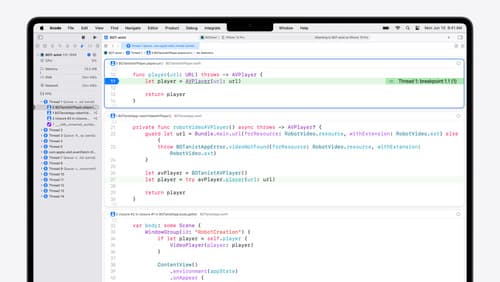
Use the Unified Backtrace View: In Xcode, you can enable the unified backtrace view from the debug bar. This visualization allows you to follow the call stack and view the surrounding code in each frame simply by scrolling down. You can also hover over variables to see their values.
For more detailed information, you can refer to the session titled "Run, Break, Inspect: Explore effective debugging in LLDB" from WWDC 2024. You can start exploring this topic at the Run, Break, Inspect: Explore effective debugging in LLDB (02:47) chapter marker.

What’s new in Xcode 16
Discover the latest productivity and performance improvements in Xcode 16. Learn about enhancements to code completion, diagnostics, and Xcode Previews. Find out more about updates in builds and explore improvements in debugging and Instruments.

Xcode essentials
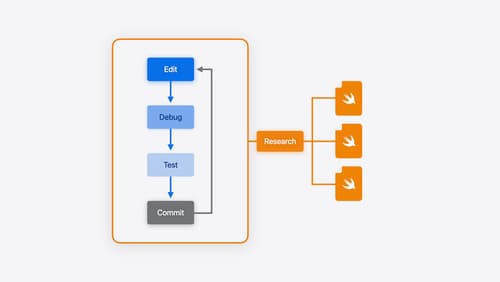
Edit, debug, commit, repeat. Explore the suite of tools in Xcode that help you iterate quickly when developing apps. Discover tips and tricks to help optimize and boost your development workflow.

Run, Break, Inspect: Explore effective debugging in LLDB
Learn how to use LLDB to explore and debug codebases. We’ll show you how to make the most of crashlogs and backtraces, and how to supercharge breakpoints with actions and complex stop conditions. We’ll also explore how the “p” command and the latest features in Swift 6 can enhance your debugging experience.
