What were the Swift Charts sessions
Asked on 2024-08-14
1 search

The Swift Charts sessions at WWDC 2024 focused on the new capabilities of Swift Charts, particularly in the area of vectorized and function plots. The session titled "Swift Charts: Vectorized and function plots" covered several key topics:
-
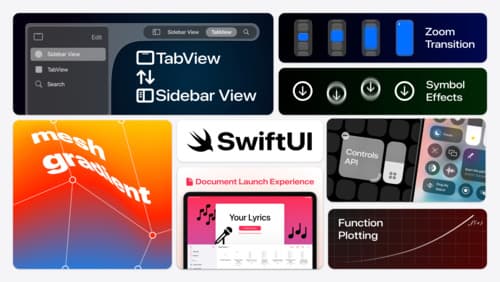
Function Plots: This segment introduced new line and area plots for visualizing mathematical functions, allowing developers to plot functions beyond just data. It also covered how to handle piecewise functions and parametric functions. You can find more details in the Swift Charts: Vectorized and function plots (01:01) session.
-
Vectorized Plots: This part of the session discussed the new vectorized plotting APIs that support visualizing larger datasets more efficiently. It also provided best practices for optimizing performance when dealing with large data sets. More information is available in the Swift Charts: Vectorized and function plots (06:48) session.
These sessions are designed to help developers create more informative, accessible, and efficient visualizations using SwiftUI.
Explore the Swift on Server ecosystem
Swift is a great language for writing your server applications, and powers critical services across Apple’s cloud products. We’ll explore tooling, delve into the Swift server package ecosystem, and demonstrate how to interact with databases and add observability to applications.
What’s new in SwiftUI
Learn how you can use SwiftUI to build great apps for any Apple platform. Explore a fresh new look and feel for tabs and documents on iPadOS. Improve your window management with new windowing APIs, and gain more control over immersive spaces and volumes in your visionOS apps. We’ll also take you through other exciting refinements that help you make expressive charts, customize and layout text, and so much more.
Swift Charts: Vectorized and function plots
The plot thickens! Learn how to render beautiful charts representing math functions and extensive datasets using function and vectorized plots in your app. Whether you’re looking to display functions common in aerodynamics, magnetism, and higher order field theory, or create large interactive heat maps, Swift Charts has you covered.