pie chart
Asked on 2024-08-16
1 search

It seems you are interested in pie charts. While the provided context does not specifically mention pie charts, it does cover various aspects of data visualization using Swift Charts, including function plots and vectorized plots. Swift Charts is a powerful tool for creating accessible and customizable data visualizations, such as line plots, area plots, and more.
If you are interested in learning more about Swift Charts and its capabilities, you might want to check out the session titled "Swift Charts: Vectorized and function plots" from WWDC 2024. This session covers how to create advanced function plots and efficiently handle large datasets with vectorized plots.
For more detailed information on Swift Charts, you can refer to the session Swift Charts: Vectorized and function plots (01:01) which discusses function plots, or Swift Charts: Vectorized and function plots (06:48) for vectorized plots.
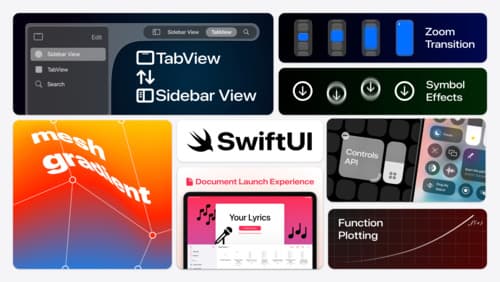
What’s new in SwiftUI
Learn how you can use SwiftUI to build great apps for any Apple platform. Explore a fresh new look and feel for tabs and documents on iPadOS. Improve your window management with new windowing APIs, and gain more control over immersive spaces and volumes in your visionOS apps. We’ll also take you through other exciting refinements that help you make expressive charts, customize and layout text, and so much more.

Port advanced games to Apple platforms
Discover how simple it can be to reach players on Apple platforms worldwide. We’ll show you how to evaluate your Windows executable on Apple silicon, start your game port with code samples, convert your shader code to Metal, and bring your game to Mac, iPhone, and iPad. Explore enhanced Metal tools that understand HLSL shaders to validate, debug, and profile your ported shaders on Metal.
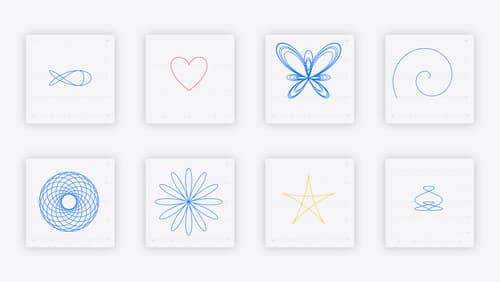
Swift Charts: Vectorized and function plots
The plot thickens! Learn how to render beautiful charts representing math functions and extensive datasets using function and vectorized plots in your app. Whether you’re looking to display functions common in aerodynamics, magnetism, and higher order field theory, or create large interactive heat maps, Swift Charts has you covered.