Memory debug
Asked on 2024-08-18
1 search

To debug memory issues in Xcode, you can utilize several tools and techniques presented at WWDC. In the session titled "Analyze heap memory," various tools for memory analysis are discussed, such as the memory graph debugger, Malloc stack logging, and command line tools like leaks, Heap, VMMAP, and Malloc history. These tools help in capturing memory graphs, analyzing allocations, and identifying memory leaks.
For a more detailed exploration of debugging techniques, the session "Run, Break, Inspect: Explore effective debugging in LLDB" covers how to use LLDB for debugging, including setting breakpoints, inspecting variables, and using the p command for expression evaluation.
If you are interested in learning more about these topics, you can refer to the following sessions:
- Analyze heap memory (03:45) - Tools for inspecting heap memory issues
- Run, Break, Inspect: Explore effective debugging in LLDB (07:27) - Breakpoints
These sessions provide a comprehensive overview of the tools and techniques available for memory debugging in Xcode.
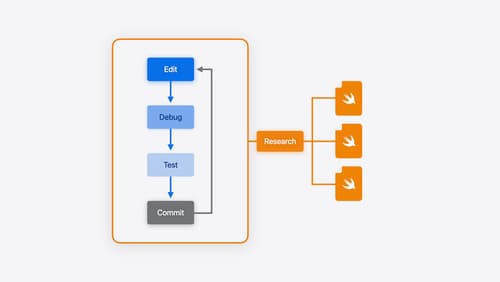
Xcode essentials
Edit, debug, commit, repeat. Explore the suite of tools in Xcode that help you iterate quickly when developing apps. Discover tips and tricks to help optimize and boost your development workflow.
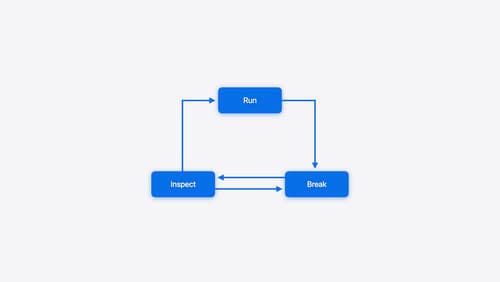
Run, Break, Inspect: Explore effective debugging in LLDB
Learn how to use LLDB to explore and debug codebases. We’ll show you how to make the most of crashlogs and backtraces, and how to supercharge breakpoints with actions and complex stop conditions. We’ll also explore how the “p” command and the latest features in Swift 6 can enhance your debugging experience.

Analyze heap memory
Dive into the basis for your app’s dynamic memory: the heap! Explore how to use Instruments and Xcode to measure, analyze, and fix common heap issues. We’ll also cover some techniques and best practices for diagnosing transient growth, persistent growth, and leaks in your app.