how do I improve my server app with tracing
Asked on 2024-08-20
1 search

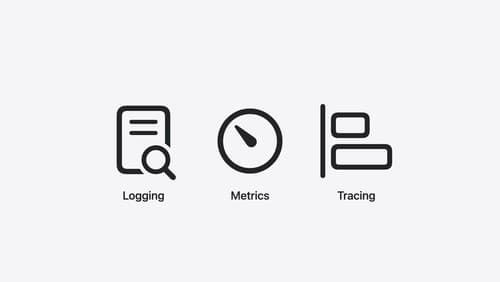
To improve your server app with tracing, you can utilize the Swift on Server ecosystem, which provides tools for observability, including logging, metrics, and distributed tracing. Here's a brief overview of how you can implement tracing:
-
Structured Logging: Use Swiftlog to emit logs with metadata, which helps in understanding what a service did and provides context for troubleshooting.
-
Metrics: Implement counters using Swiftmetrics to track the number of requests processed by your service. This gives a high-level overview of your service's health.
-
Distributed Tracing: Add Swift distributed tracing to create spans around critical operations like database queries. This helps in tracing the path of a request through your system, which is particularly useful in distributed systems.
The APIs for these observability tools are backend agnostic, allowing you to choose where to send the data. You can bootstrap these systems in your application, starting with logging, followed by metrics, and then instrumentation.
For more detailed guidance, you can refer to the session Explore the Swift on Server ecosystem (10:53) from WWDC 2024, which covers observability in the Swift on Server ecosystem.

Analyze heap memory
Dive into the basis for your app’s dynamic memory: the heap! Explore how to use Instruments and Xcode to measure, analyze, and fix common heap issues. We’ll also cover some techniques and best practices for diagnosing transient growth, persistent growth, and leaks in your app.
Explore the Swift on Server ecosystem
Swift is a great language for writing your server applications, and powers critical services across Apple’s cloud products. We’ll explore tooling, delve into the Swift server package ecosystem, and demonstrate how to interact with databases and add observability to applications.
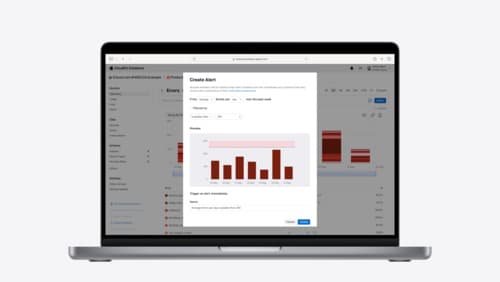
Use CloudKit Console to monitor and optimize database activity
Discover the new observability features in CloudKit Console. Learn how to use Telemetry and Logging to troubleshoot and optimize your app. Find out how to set up alerts to monitor your application’s behavior and notifications to stay on top of the container events that are most important to you. To get the most out of this session, we recommend being familiar with CloudKit containers.