How to compare the CPU usage of two builds of the same app?
Asked on 2024-08-21
1 search

To compare the CPU usage of two builds of the same app, you can use the Instruments tool available in Xcode. Here's a step-by-step guide based on the content from WWDC:
-
Profile Your App: Use the Instruments tool to profile your app. You can access it from the profile action right from Xcode. This tool allows you to visualize CPU usage and measure how long different parts of your code take to run.
-
Use the Time Profiler Instrument: Record a trace of your app's launch or any specific operation you want to compare. The Time Profiler instrument will help you visualize CPU usage in your code.
-
Analyze the Data: Set the inspection range to the interval you are interested in, such as the hang interval during the app launch. This will help you narrow down the problem areas.
-
Use the Flame Graph: Activate the flame graph from the jump bar in Instruments. The flame graph provides a high-level overview of the trace execution, allowing you to see where CPU usage is concentrated.
-
Compare Builds: Repeat the above steps for both builds of your app. Compare the flame graphs and CPU usage data to identify differences in performance.
For more detailed information on using these tools, you can refer to the session What’s new in Xcode 16 (18:42) where these features are discussed.
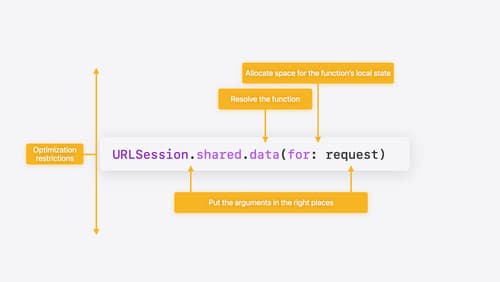
Explore Swift performance
Discover how Swift balances abstraction and performance. Learn what elements of performance to consider and how the Swift optimizer affects them. Explore the different features of Swift and how they’re implemented to further understand the tradeoffs available that can impact performance.
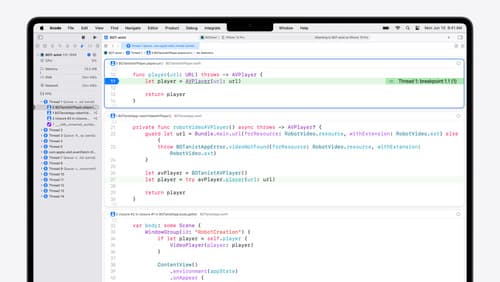
What’s new in Xcode 16
Discover the latest productivity and performance improvements in Xcode 16. Learn about enhancements to code completion, diagnostics, and Xcode Previews. Find out more about updates in builds and explore improvements in debugging and Instruments.
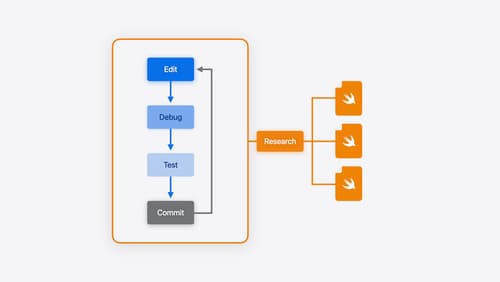
Xcode essentials
Edit, debug, commit, repeat. Explore the suite of tools in Xcode that help you iterate quickly when developing apps. Discover tips and tricks to help optimize and boost your development workflow.