instruments profiler
Asked on 2024-09-06
1 search

The Instruments Profiler is a powerful tool for diagnosing performance issues in your applications, as discussed in several sessions at WWDC 2024. Here are some highlights:
-
Profiling Games: In the session "Port advanced games to Apple platforms," the use of Instruments is highlighted for measuring and analyzing a game's overall impact on the system. This includes profiling shaders and using tools like the Metal System Trace to debug and optimize game performance. You can find more about this in the Debug and profile with Metal tools chapter.
-
Heap Memory Analysis: The session "Analyze heap memory" discusses using Instruments to profile heap memory, focusing on allocations and memory leaks. The session provides insights into using the allocations instrument to track memory usage and identify persistent growth patterns. More details can be found in the Tools for inspecting heap memory issues chapter.
-
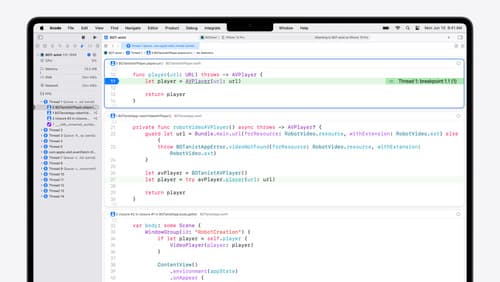
Xcode 16 Enhancements: In "What’s new in Xcode 16," Instruments is mentioned as a key tool for diagnosing performance problems, with new features like the flame graph for visualizing CPU usage and execution time. This is covered in the What's new in Instruments chapter.
These sessions provide a comprehensive overview of how to use Instruments for profiling and optimizing different aspects of your applications, from game performance to memory management.
What’s new in Xcode 16
Discover the latest productivity and performance improvements in Xcode 16. Learn about enhancements to code completion, diagnostics, and Xcode Previews. Find out more about updates in builds and explore improvements in debugging and Instruments.
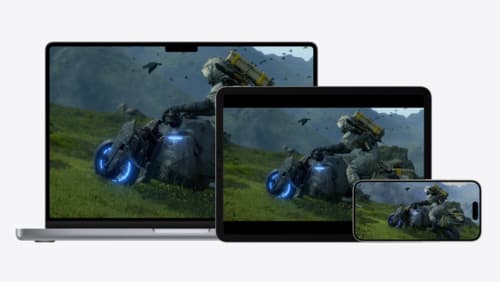
Port advanced games to Apple platforms
Discover how simple it can be to reach players on Apple platforms worldwide. We’ll show you how to evaluate your Windows executable on Apple silicon, start your game port with code samples, convert your shader code to Metal, and bring your game to Mac, iPhone, and iPad. Explore enhanced Metal tools that understand HLSL shaders to validate, debug, and profile your ported shaders on Metal.
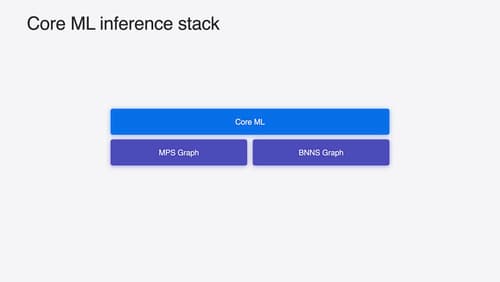
Deploy machine learning and AI models on-device with Core ML
Learn new ways to optimize speed and memory performance when you convert and run machine learning and AI models through Core ML. We’ll cover new options for model representations, performance insights, execution, and model stitching which can be used together to create compelling and private on-device experiences.