why is my app crashing
Asked on 2024-09-06
1 search

If your app is crashing, there are several debugging techniques and tools discussed at WWDC that can help you diagnose and fix the issue. Here are some key points from the sessions:
-
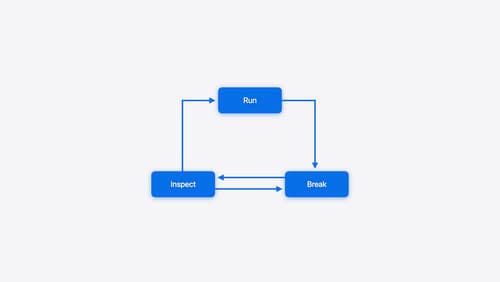
Crash Logs and Backtraces: In the session "Run, Break, Inspect: Explore effective debugging in LLDB," it is highlighted that crash logs and backtraces are powerful tools to understand the control flow of the program and identify the source of a crash. You can use LLDB to consume crash logs and present them in a form that resembles a debugging session. This can help you perform an initial investigation into how the crash happened. For more details, you can refer to the Crashlogs & starting the program chapter.
-
Breakpoints: Setting breakpoints can help you track down the exact location in your code where the crash occurs. You can set a breakpoint right before the function that is causing the crash to see if it brings you closer to the bug. This is discussed in the Breakpoints chapter of the same session.
-
Thread Performance Checker: In the session "What’s new in Xcode 16," the thread performance checker is introduced as a tool to surface runtime issues, such as loading assets on the main thread, which can lead to performance problems and crashes. You can set breakpoints and use the unified backtrace view to trace where the call is coming from. More information can be found in the Thread performance checker chapter.
-
Memory Management: If your app is crashing due to memory issues, the session "Analyze heap memory" provides insights into managing memory effectively. It covers tools for inspecting heap memory issues and strategies for managing memory growth. You can explore the Tools for inspecting heap memory issues chapter for more information.
By leveraging these tools and techniques, you can gain a better understanding of why your app is crashing and take steps to resolve the issues.
Run, Break, Inspect: Explore effective debugging in LLDB
Learn how to use LLDB to explore and debug codebases. We’ll show you how to make the most of crashlogs and backtraces, and how to supercharge breakpoints with actions and complex stop conditions. We’ll also explore how the “p” command and the latest features in Swift 6 can enhance your debugging experience.

Analyze heap memory
Dive into the basis for your app’s dynamic memory: the heap! Explore how to use Instruments and Xcode to measure, analyze, and fix common heap issues. We’ll also cover some techniques and best practices for diagnosing transient growth, persistent growth, and leaks in your app.
What’s new in Xcode 16
Discover the latest productivity and performance improvements in Xcode 16. Learn about enhancements to code completion, diagnostics, and Xcode Previews. Find out more about updates in builds and explore improvements in debugging and Instruments.