swift debuging
Asked on 2024-09-24
1 search
To effectively debug Swift code, Apple introduced several new features and techniques at WWDC 2024. Here are some highlights from the sessions:
-
Xcode 16 Enhancements:
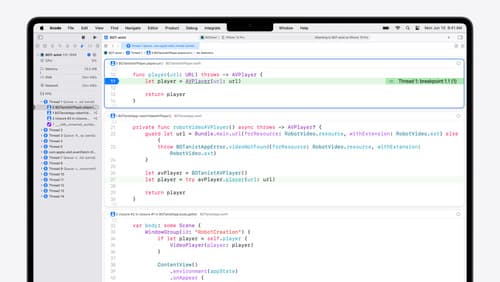
- In Xcode 16, you can view full backtraces in the editor, which helps in understanding how you reached a particular point in your code. This feature is accessible in the debug bar next to the memory and view debugger controls. Instead of using print statements, consider using
os_logfor more structured logging. Xcode essentials (21:17)
- In Xcode 16, you can view full backtraces in the editor, which helps in understanding how you reached a particular point in your code. This feature is accessible in the debug bar next to the memory and view debugger controls. Instead of using print statements, consider using
-
LLDB Debugging Techniques:
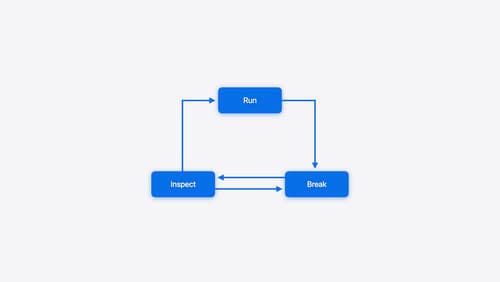
- The session "Run, Break, Inspect: Explore effective debugging in LLDB" covers various debugging techniques using LLDB, the underlying debugger in Xcode. It introduces the
@DebugDescriptionmacro, which allows you to customize how data types appear in the debugger. This session also discusses the use of thepcommand, which has been reworked to save time by combining multiple tools under a single command. Run, Break, Inspect: Explore effective debugging in LLDB (01:02)
- The session "Run, Break, Inspect: Explore effective debugging in LLDB" covers various debugging techniques using LLDB, the underlying debugger in Xcode. It introduces the
-
Swift Error Breakpoints:
- Swift error breakpoints are a new feature that stops the application as soon as a Swift error is thrown, allowing you to quickly identify and fix issues. This can be particularly useful when dealing with high-firing breakpoints or when you need to focus on specific error conditions. Run, Break, Inspect: Explore effective debugging in LLDB (23:18)
These sessions provide a comprehensive overview of the new debugging tools and techniques available in Xcode 16 and LLDB, making it easier to debug Swift applications effectively.

Xcode essentials
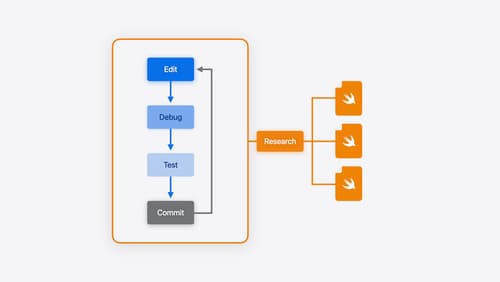
Edit, debug, commit, repeat. Explore the suite of tools in Xcode that help you iterate quickly when developing apps. Discover tips and tricks to help optimize and boost your development workflow.

What’s new in Xcode 16
Discover the latest productivity and performance improvements in Xcode 16. Learn about enhancements to code completion, diagnostics, and Xcode Previews. Find out more about updates in builds and explore improvements in debugging and Instruments.

Run, Break, Inspect: Explore effective debugging in LLDB
Learn how to use LLDB to explore and debug codebases. We’ll show you how to make the most of crashlogs and backtraces, and how to supercharge breakpoints with actions and complex stop conditions. We’ll also explore how the “p” command and the latest features in Swift 6 can enhance your debugging experience.
