what about app performance measure
Asked on 2024-09-25
1 search
To measure app performance, Apple provides several tools and techniques discussed in various WWDC sessions. Here are some key points:
-
Instruments in Xcode: Instruments is a powerful tool for diagnosing performance problems. It allows you to visualize CPU usage and measure how long different parts of your code take to run. You can use features like the flame graph to get a high-level overview of trace execution, which helps in identifying performance bottlenecks. This is discussed in the session What’s new in Xcode 16.
-
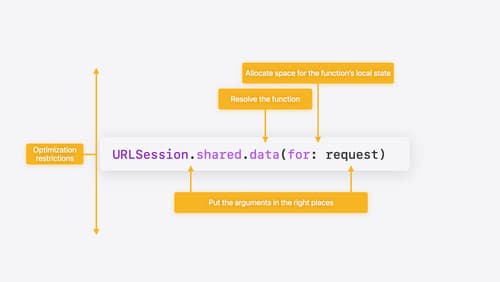
Swift Performance: Understanding low-level performance in Swift involves looking at function calls, memory allocation, and other principles. The session "Explore Swift performance" delves into these aspects, emphasizing the importance of measuring and automating performance checks to identify regressions. This session also covers the costs associated with function calls and memory management.
-
Heap Memory Analysis: The session "Analyze heap memory" discusses how to measure heap memory with instruments, identify patterns of transient and persistent growth, and use Xcode's memory graph debugger to find and resolve memory issues.
-
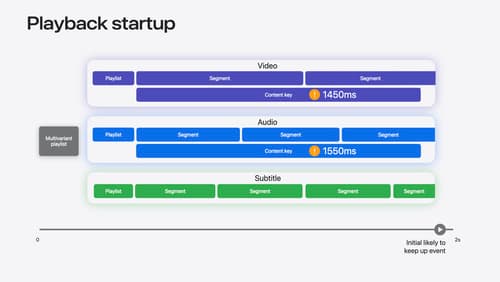
Media Performance Metrics: For media playback, the session "Discover media performance metrics in AVFoundation" introduces new APIs in iOS 18 that provide enriched client-side analytics to help triage issues and improve media playback performance.
These sessions provide a comprehensive overview of the tools and methodologies available for measuring and improving app performance.

Explore Swift performance
Discover how Swift balances abstraction and performance. Learn what elements of performance to consider and how the Swift optimizer affects them. Explore the different features of Swift and how they’re implemented to further understand the tradeoffs available that can impact performance.

Discover media performance metrics in AVFoundation
Discover how you can monitor, analyze, and improve user experience with the new media performance APIs. Explore how to monitor AVPlayer performance for HLS assets using different AVMetricEvents, and learn how to use these metrics to understand and triage player performance issues.

Platforms State of the Union
Discover the newest advancements on Apple platforms.
