how can I learn swift charts
Asked on 2024-09-25
1 search
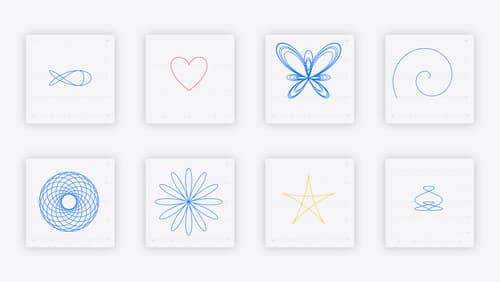
To learn Swift Charts, you can start by exploring the session titled "Swift Charts: Vectorized and function plots" from WWDC 2024. This session introduces the new capabilities of Swift Charts, including vectorized plotting APIs and function plots. It covers how to create informative and accessible visualizations using SwiftUI, and demonstrates how to plot mathematical functions and handle advanced function plots like parametric and piecewise functions.
For a more detailed understanding, you can watch the session starting from the chapter on Function plots. This will give you insights into creating both simple and advanced function plots, customizing them, and making them accessible.
Additionally, if you are new to Swift Charts, it is recommended to check out previous talks to get started with the basics. The session also suggests downloading the sample project to explore more examples and interactions with function plots.
If you are interested in how Swift Charts integrates with other frameworks, the session "What’s new in SwiftUI" also touches on improvements in Swift Charts and how they can be used to create beautiful graphs and visualizations. You can find this in the chapter on Vectorized and function plots.

Get started with HealthKit in visionOS
Discover how to use HealthKit to create experiences that take full advantage of the spatial canvas. Learn the capabilities of HealthKit on the platform, find out how to bring an existing iPadOS app to visionOS, and explore the special considerations governing HealthKit during a Guest User session. You’ll also learn ways to use SwiftUI, Swift Charts, and Swift concurrency to craft innovative experiences with HealthKit.

A Swift Tour: Explore Swift’s features and design
Learn the essential features and design philosophy of the Swift programming language. We’ll explore how to model data, handle errors, use protocols, write concurrent code, and more while building up a Swift package that has a library, an HTTP server, and a command line client. Whether you’re just beginning your Swift journey or have been with us from the start, this talk will help you get the most out of the language.

Swift Charts: Vectorized and function plots
The plot thickens! Learn how to render beautiful charts representing math functions and extensive datasets using function and vectorized plots in your app. Whether you’re looking to display functions common in aerodynamics, magnetism, and higher order field theory, or create large interactive heat maps, Swift Charts has you covered.
