code
Asked on 2024-10-04
1 search
It seems like you're interested in code-related topics from the WWDC sessions. Here are some highlights from the sessions that might be relevant to your interests:
-
Platforms State of the Union: This session introduced a new engine in Xcode that predicts the code you need. It's specifically trained for Swift and Apple SDKs, using your project symbols to customize suggestions. This feature runs locally on your Mac, ensuring privacy and fast results, even offline. You can see this in action in the Platforms State of the Union session.
-
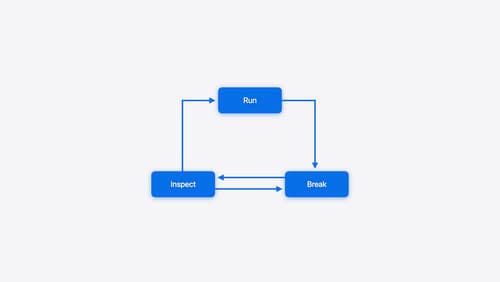
Run, Break, Inspect: Explore effective debugging in LLDB: This session covers various debugging techniques in Xcode, including the use of breakpoints and the
pcommand for inspecting variables. It also discusses handling high-firing breakpoints and using Swift error breakpoints to catch errors as soon as they occur. You can explore these techniques in the Run, Break, Inspect: Explore effective debugging in LLDB session. -
Xcode essentials: This session provides tips and tricks for debugging, including using breakpoints effectively and making print statement debugging more efficient. It also covers navigating and managing code within Xcode. Check out the Xcode essentials session for more details.
-
What’s new in Xcode 16: This session highlights new features in Xcode 16, such as the thread performance checker, which helps identify runtime issues impacting users. It also introduces new debugging tools and improvements. You can learn more in the What’s new in Xcode 16 session.
These sessions provide a comprehensive overview of the latest tools and techniques for coding and debugging in Xcode. If you have specific questions about these topics, feel free to ask!

Platforms State of the Union
Discover the newest advancements on Apple platforms.

Run, Break, Inspect: Explore effective debugging in LLDB
Learn how to use LLDB to explore and debug codebases. We’ll show you how to make the most of crashlogs and backtraces, and how to supercharge breakpoints with actions and complex stop conditions. We’ll also explore how the “p” command and the latest features in Swift 6 can enhance your debugging experience.

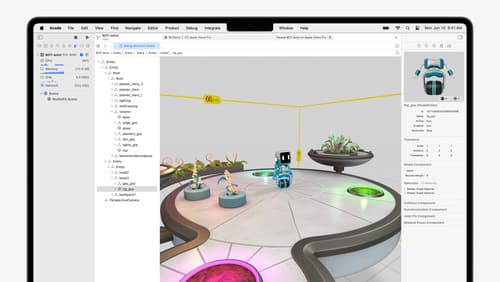
Break into the RealityKit debugger
Meet the RealityKit debugger and discover how this new tool lets you inspect the entity hierarchy of spatial apps, debug rogue transformations, find missing entities, and detect which parts of your code are causing problems for your systems.
