Memory manegment
Asked on 2024-10-05
1 search
To understand memory management, particularly in the context of Apple's WWDC sessions, we can look at the session titled "Analyze heap memory" from WWDC 2024. This session provides insights into how heap memory is managed, including the allocation and deallocation processes, and how to identify and fix memory leaks.
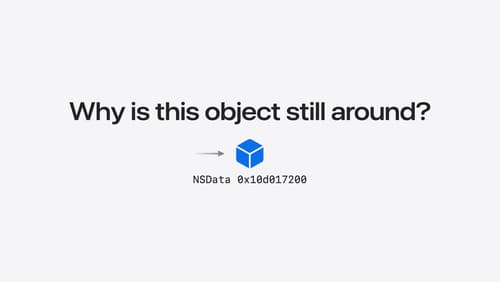
Heap memory is created using functions like malloc, and it is responsible for a significant portion of an application's memory footprint. The session discusses the importance of ensuring that all memory in your program is reachable through non-weak references to avoid leaks. Leaked memory is unreachable and cannot be used again, often due to lost pointers or reference cycles.
The session also covers tools for inspecting heap memory issues, such as Xcode's memory graph debugger and Malloc stack logging, which help track memory allocations and identify leaks. Additionally, it discusses managing autorelease pool growth in Swift, which can lead to temporary memory growth.
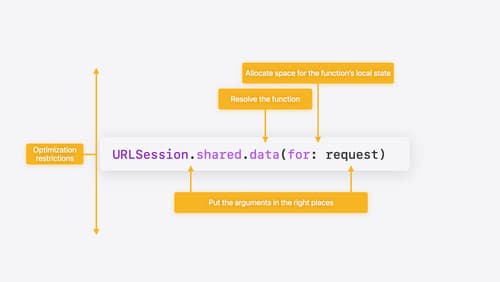
For more detailed information, you can refer to the session Analyze heap memory (00:01:05) for an overview of heap memory and Explore Swift performance (00:08:29) for insights into memory allocation in Swift.

Explore Swift performance
Discover how Swift balances abstraction and performance. Learn what elements of performance to consider and how the Swift optimizer affects them. Explore the different features of Swift and how they’re implemented to further understand the tradeoffs available that can impact performance.

Analyze heap memory
Dive into the basis for your app’s dynamic memory: the heap! Explore how to use Instruments and Xcode to measure, analyze, and fix common heap issues. We’ll also cover some techniques and best practices for diagnosing transient growth, persistent growth, and leaks in your app.
