performance
Asked on 2024-10-05
4 searches
The topic of performance was discussed in several sessions at WWDC 2024. Here are some key points:
-
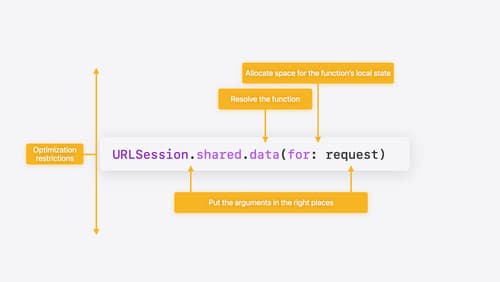
Explore Swift Performance: This session delves into the multidimensional and situational nature of performance. It emphasizes the importance of understanding both high-level and low-level performance issues, using tools like Instruments to identify and solve problems. The session also highlights the role of Swift's powerful optimizer and the need for regular performance monitoring to identify regressions. You can explore more about performance in Swift by checking out the session Explore Swift performance (01:46).
-
What’s New in Xcode 16: This session introduces the new flame graph feature in Instruments, which provides a high-level overview of trace execution. It helps in identifying performance issues by visualizing code execution intervals. The session also discusses using the time profiler instrument to diagnose performance problems, such as high CPU usage during app launch. For more details, see What’s new in Xcode 16 (19:44).
-
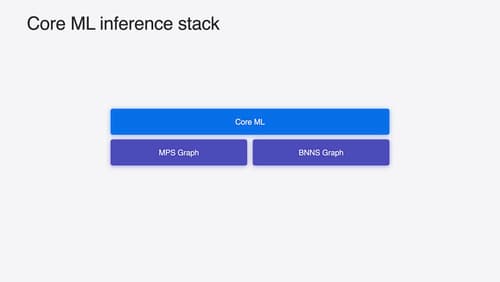
Deploy Machine Learning and AI Models on-device with Core ML: This session covers performance tools for machine learning models, including a performance report that offers detailed information on load and prediction times, and compute unit usage. It helps identify bottlenecks in your network by sorting operations based on their estimated time. For more information, refer to Deploy machine learning and AI models on-device with Core ML (15:27).
These sessions provide a comprehensive overview of performance considerations across different areas of development, from Swift programming to machine learning and app development in Xcode.

Explore Swift performance
Discover how Swift balances abstraction and performance. Learn what elements of performance to consider and how the Swift optimizer affects them. Explore the different features of Swift and how they’re implemented to further understand the tradeoffs available that can impact performance.

Deploy machine learning and AI models on-device with Core ML
Learn new ways to optimize speed and memory performance when you convert and run machine learning and AI models through Core ML. We’ll cover new options for model representations, performance insights, execution, and model stitching which can be used together to create compelling and private on-device experiences.

Analyze heap memory
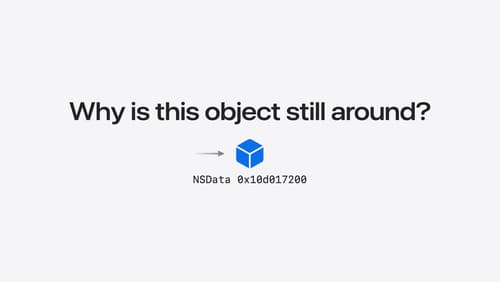
Dive into the basis for your app’s dynamic memory: the heap! Explore how to use Instruments and Xcode to measure, analyze, and fix common heap issues. We’ll also cover some techniques and best practices for diagnosing transient growth, persistent growth, and leaks in your app.
