optimizing swift perfomance
Asked on 2024-10-14
1 search
To optimize Swift performance, there are several key considerations and strategies discussed in the WWDC sessions:
-
Understanding Performance Costs: Swift provides many tools for abstraction, such as closures and generics, which have non-trivial implementations. It's important to develop an intuition for how these abstractions impact performance. The Swift optimizer is powerful, but the way you write code can significantly affect its ability to optimize effectively. Regularly monitoring performance and identifying hotspots is crucial (Explore Swift performance).
-
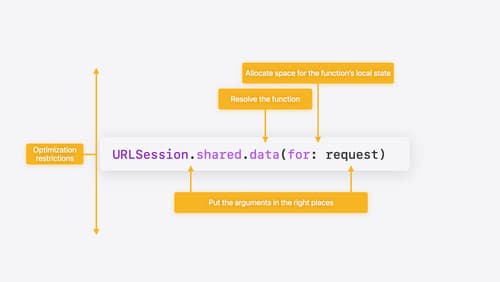
Low-Level Performance Considerations: Performance issues can arise from ineffective optimization of function calls, inefficient data representation, excessive memory allocation, and unnecessary copying and destroying of values. Understanding these aspects can help in optimizing Swift code (Explore Swift performance).
-
Heap Memory Management: Enabling whole module optimization can reduce overhead by allowing more inlining. Profiling can help identify expensive struct copies, and minimizing the use of reference types and copy-on-write types can improve performance. It's also important to avoid circumventing ARC, as manual reference counting can lead to hard-to-debug leaks (Analyze heap memory).
-
Build Improvements: Improvements in how Xcode builds Swift code can also contribute to performance optimization. Explicitly built modules can reduce build times and improve parallelism, which is beneficial for performance (What’s new in Swift).
For more detailed insights, you can refer to the sessions "Explore Swift performance" and "Analyze heap memory" from WWDC 2024.

What’s new in Swift
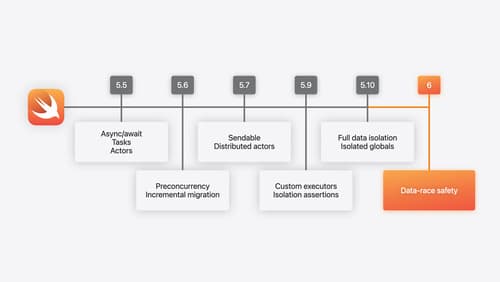
Join us for an update on Swift. We’ll briefly go through a history of Swift over the past decade, and show you how the community has grown through workgroups, expanded the package ecosystem, and increased platform support. We’ll introduce you to a new language mode that achieves data-race safety by default, and a language subset that lets you run Swift on highly constrained systems. We’ll also explore some language updates including noncopyable types, typed throws, and improved C++ interoperability.

Explore Swift performance
Discover how Swift balances abstraction and performance. Learn what elements of performance to consider and how the Swift optimizer affects them. Explore the different features of Swift and how they’re implemented to further understand the tradeoffs available that can impact performance.

Analyze heap memory
Dive into the basis for your app’s dynamic memory: the heap! Explore how to use Instruments and Xcode to measure, analyze, and fix common heap issues. We’ll also cover some techniques and best practices for diagnosing transient growth, persistent growth, and leaks in your app.
