how to debug iOS app
Asked on 2024-10-26
1 search
To debug an iOS app effectively, you can utilize several tools and techniques available in Xcode and LLDB, as discussed in various sessions at WWDC 2024.
-
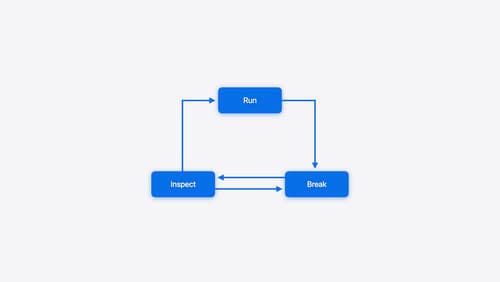
Using LLDB for Debugging: The session "Run, Break, Inspect: Explore effective debugging in LLDB" provides insights into using LLDB for debugging. It emphasizes the importance of the run-break-inspect loop and how to use crash logs to understand program state at the time of a crash. You can start by reproducing the bug and using LLDB to inspect the program state and backtrace to understand the sequence of function calls leading to the issue.
-
Xcode Debugging Tools: The session "Xcode essentials" covers various debugging tools in Xcode. It highlights the use of breakpoints, the console, and the debug navigator to diagnose and fix issues. You can disable breakpoints to run the app without interruptions and use command-control-R to run without building, which speeds up the debugging process.
-
New Features in Xcode 16: The session "What’s new in Xcode 16" introduces new debugging features like the thread performance checker, which helps identify runtime issues by pinpointing problematic lines of code. The unified backtrace view allows you to trace the call stack and inspect variables easily.
For a more detailed exploration of debugging in LLDB, you can refer to the session Run, Break, Inspect: Explore effective debugging in LLDB (03:46).
These sessions provide a comprehensive overview of the tools and techniques available for debugging iOS apps effectively.

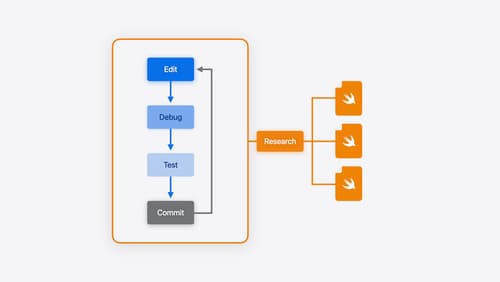
Xcode essentials
Edit, debug, commit, repeat. Explore the suite of tools in Xcode that help you iterate quickly when developing apps. Discover tips and tricks to help optimize and boost your development workflow.

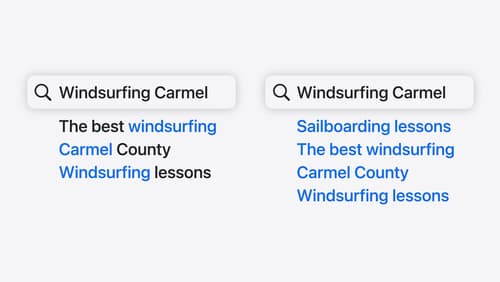
Support semantic search with Core Spotlight
Learn how to provide semantic search results in your app using Core Spotlight. Understand how to make your app’s content available in the user’s private, on-device index so people can search for items using natural language. We’ll also share how to optimize your app’s performance by scheduling indexing activities. To get the most out of this session, we recommend first checking out Core Spotlight documentation on the Apple Developer website.

Run, Break, Inspect: Explore effective debugging in LLDB
Learn how to use LLDB to explore and debug codebases. We’ll show you how to make the most of crashlogs and backtraces, and how to supercharge breakpoints with actions and complex stop conditions. We’ll also explore how the “p” command and the latest features in Swift 6 can enhance your debugging experience.
