profiling laughing an app
Asked on 2024-11-01
1 search
To profile the launch of an app, you can use the tools and techniques discussed in the session "What’s new in Xcode 16" at WWDC 2024. Specifically, the session highlights the use of the Time Profiler instrument, which visualizes CPU usage and helps measure the time taken for code execution during app launch. The session also introduces the new flame graph feature in Instruments, which provides a high-level overview of trace execution, allowing you to spot performance issues quickly.
For more detailed information, you can refer to the chapter "What's new in Instruments" and "Meet the flame graph" in the session "What’s new in Xcode 16".

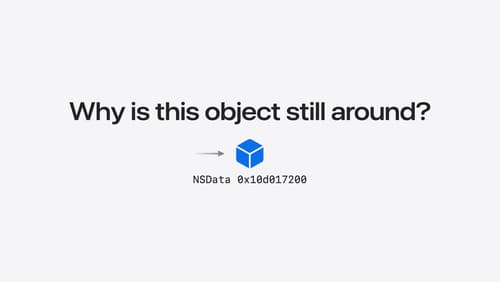
Analyze heap memory
Dive into the basis for your app’s dynamic memory: the heap! Explore how to use Instruments and Xcode to measure, analyze, and fix common heap issues. We’ll also cover some techniques and best practices for diagnosing transient growth, persistent growth, and leaks in your app.

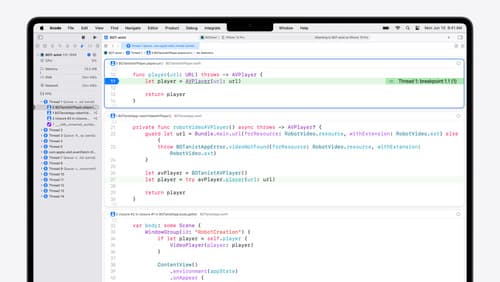
What’s new in Xcode 16
Discover the latest productivity and performance improvements in Xcode 16. Learn about enhancements to code completion, diagnostics, and Xcode Previews. Find out more about updates in builds and explore improvements in debugging and Instruments.

Platforms State of the Union
Discover the newest advancements on Apple platforms.
