Deep dive
Asked on 2025-01-07
1 search

It seems like you're interested in a deep dive into the content presented at Apple's WWDC. Here are some highlights from the sessions that might interest you:
-
Analyze Heap Memory: This session provides insights into managing memory effectively, focusing on heap memory issues. It discusses tools for inspecting memory, managing autorelease pool growth, and using the Xcode memory graph debugger. You can explore more about transient memory growth and persistent memory growth in this session.
-
Run, Break, Inspect: Explore effective debugging in LLDB: This session covers the main concepts required to effectively use a debugger, treating debugging as a search problem with conditional breakpoints and variable inspection. It also highlights the use of LLDB for understanding unfamiliar codebases.
-
What’s new in Xcode 16: This session introduces new features in Xcode 16, including the flame graph in Instruments, which provides a high-level overview of trace execution to spot issues quickly.
-
Explore Swift performance: This session delves into low-level performance considerations in Swift, such as function calls, memory allocation, and value copying. It emphasizes understanding how code runs to optimize performance.
-
Discover RealityKit APIs for iOS, macOS, and visionOS: This session explores new RealityKit APIs, including features like low-level mesh and texture access, animation timelines, and pixel-perfect entity selection.
If you have a specific topic or session you want to explore further, feel free to ask!

Discover RealityKit APIs for iOS, macOS and visionOS
Learn how new cross-platform APIs in RealityKit can help you build immersive apps for iOS, macOS, and visionOS. Check out the new hover effects, lights and shadows, and portal crossing features, and view them in action through real examples.
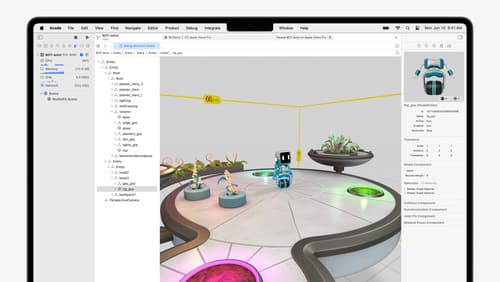
Break into the RealityKit debugger
Meet the RealityKit debugger and discover how this new tool lets you inspect the entity hierarchy of spatial apps, debug rogue transformations, find missing entities, and detect which parts of your code are causing problems for your systems.
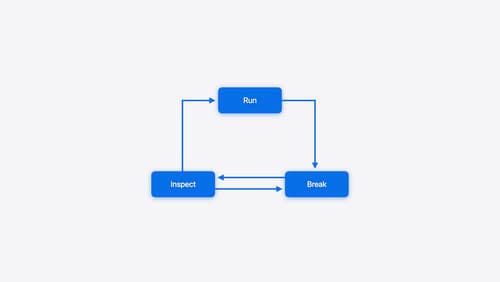
Run, Break, Inspect: Explore effective debugging in LLDB
Learn how to use LLDB to explore and debug codebases. We’ll show you how to make the most of crashlogs and backtraces, and how to supercharge breakpoints with actions and complex stop conditions. We’ll also explore how the “p” command and the latest features in Swift 6 can enhance your debugging experience.