time profile
Asked on 2025-01-08
1 search

It seems like you're interested in profiling and analyzing performance, particularly in the context of memory and execution time. At WWDC 2024, Apple presented several sessions that might be relevant to your interest in profiling:
-
Analyze heap memory: This session covers tools and techniques for inspecting heap memory issues, including how to profile an app's heap using allocations and VM tracker. You can learn more about this in the session Analyze heap memory (06:20).
-
What’s new in Xcode 16: This session introduces the new flame graph feature in Instruments, which provides a high-level overview of trace execution to help spot performance issues quickly. You can explore this feature in the session What’s new in Xcode 16 (19:44).
-
Deploy machine learning and AI models on-device with Core ML: This session discusses performance tools for machine learning models, including estimator time and compute device support, which can help identify bottlenecks in your network. You can find more details in the session Deploy machine learning and AI models on-device with Core ML (15:27).
These sessions provide insights into profiling and optimizing both memory usage and execution time, which are crucial for improving app performance.
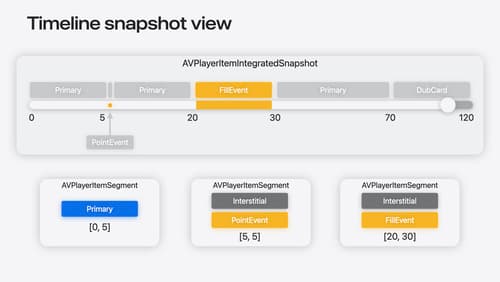
Enhance ad experiences with HLS interstitials
Explore how HLS Interstitials can help you seamlessly insert advertisements into your HLS content. We’ll also show you how to use integrated timeline to tune your UI experience and build SharePlay for interstitials.
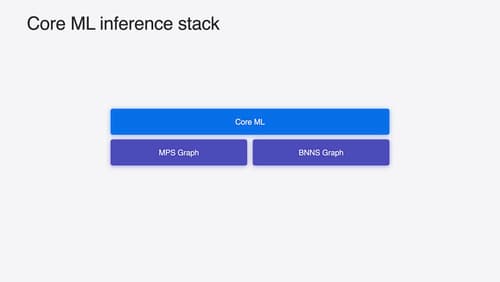
Deploy machine learning and AI models on-device with Core ML
Learn new ways to optimize speed and memory performance when you convert and run machine learning and AI models through Core ML. We’ll cover new options for model representations, performance insights, execution, and model stitching which can be used together to create compelling and private on-device experiences.

Analyze heap memory
Dive into the basis for your app’s dynamic memory: the heap! Explore how to use Instruments and Xcode to measure, analyze, and fix common heap issues. We’ll also cover some techniques and best practices for diagnosing transient growth, persistent growth, and leaks in your app.