reduce cold start app launch
Asked on 2025-02-26
1 search

To reduce cold start app launch times, you can utilize several tools and techniques introduced in Xcode 16, as discussed in the WWDC 2024 sessions.
-
Use Instruments for Performance Profiling: Instruments is a powerful tool for diagnosing performance issues. You can use the Time Profiler instrument to visualize CPU usage and measure how long your app takes to launch. By analyzing the data, you can identify bottlenecks, such as excessive CPU usage or long hangs during the initial launch. The new flame graph feature in Instruments provides a high-level overview of trace execution, helping you spot issues quickly (What’s new in Xcode 16).
-
Optimize Asset Loading: If your app is loading assets serially on the main thread, consider parallelizing the loading using a task group. This approach moves the execution of this work to the background, preventing it from blocking the main thread and improving launch times (What’s new in Xcode 16).
-
Analyze Disk Write and Slow App Launch Diagnostics: Xcode 16 includes diagnostics for excessive disk writes and slow app launches. These diagnostics can help you identify and prioritize fixing issues that have the largest impact on your app's performance. The organizer in Xcode will show you the slowest code path signatures, allowing you to focus on the most critical areas (What’s new in Xcode 16).
By leveraging these tools and techniques, you can effectively reduce cold start app launch times and improve the overall performance of your app.
Design App Intents for system experiences
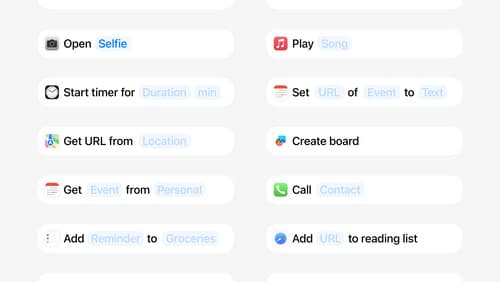
App Intents power system experiences in controls, Spotlight, Siri, and more. Find out how to identify the functionality that’s best for App Intents, and how to use parameters to make these intents flexible. Learn how to use App Intents to allow people to take action outside your app, and see examples of when to navigate into your app to show contextual information.
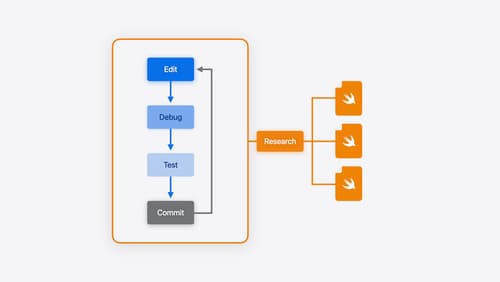
Xcode essentials
Edit, debug, commit, repeat. Explore the suite of tools in Xcode that help you iterate quickly when developing apps. Discover tips and tricks to help optimize and boost your development workflow.
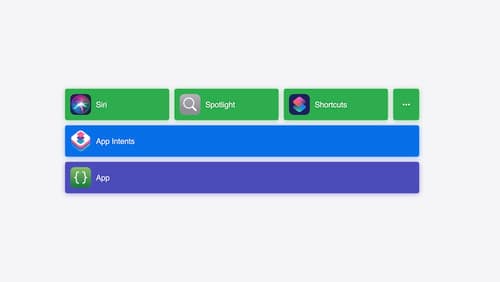
Bring your app’s core features to users with App Intents
Learn the principles of the App Intents framework, like intents, entities, and queries, and how you can harness them to expose your app’s most important functionality right where people need it most. Find out how to build deep integration between your app and the many system features built on top of App Intents, including Siri, controls and widgets, Apple Pencil, Shortcuts, the Action button, and more. Get tips on how to build your App Intents integrations efficiently to create the best experiences in every surface while still sharing code and core functionality.