monitor app performance
Asked on 2025-02-26
1 search

To monitor app performance, Apple provides several tools and features discussed in the WWDC sessions:
-
Xcode 16 Enhancements:
- Thread Performance Checker: This tool helps identify main thread hangs, priority inversions, excessive disk writes, and slow app launches. It provides diagnostic logs to help prioritize and fix issues impacting app performance (What’s new in Xcode 16).
- Instruments: A powerful tool for diagnosing performance problems, such as slow app launches. The Time Profiler instrument can visualize CPU usage and measure execution time, helping to identify bottlenecks (What’s new in Xcode 16).
-
CloudKit Console:
- Telemetry and Alerts: The CloudKit Console allows you to monitor database activity, including errors, requests, bandwidth, and latency. You can set up alerts to notify you of specific conditions, such as error rates exceeding a threshold, which helps in proactively managing app performance issues (Use CloudKit Console to monitor and optimize database activity).
-
Heap Memory Analysis:
- Memory Graph Debugger: This tool captures memory graphs to analyze allocations and references, helping to identify memory issues that could affect app performance (Analyze heap memory).
These tools and features provide a comprehensive approach to monitoring and optimizing app performance, from identifying and fixing code-level issues to managing database activity and memory usage.
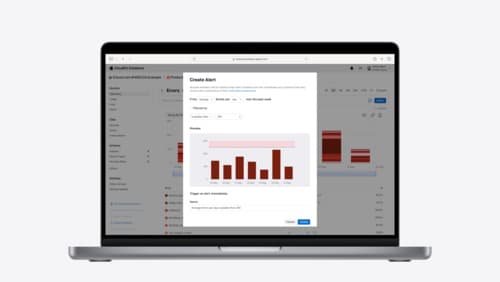
Use CloudKit Console to monitor and optimize database activity
Discover the new observability features in CloudKit Console. Learn how to use Telemetry and Logging to troubleshoot and optimize your app. Find out how to set up alerts to monitor your application’s behavior and notifications to stay on top of the container events that are most important to you. To get the most out of this session, we recommend being familiar with CloudKit containers.
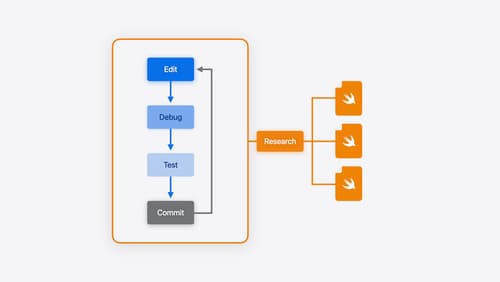
Xcode essentials
Edit, debug, commit, repeat. Explore the suite of tools in Xcode that help you iterate quickly when developing apps. Discover tips and tricks to help optimize and boost your development workflow.
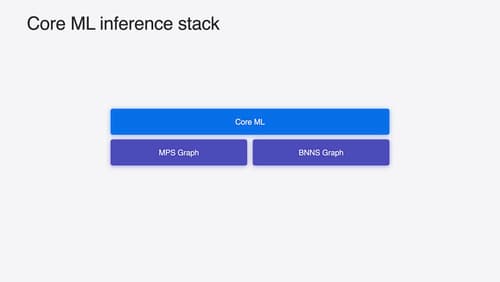
Deploy machine learning and AI models on-device with Core ML
Learn new ways to optimize speed and memory performance when you convert and run machine learning and AI models through Core ML. We’ll cover new options for model representations, performance insights, execution, and model stitching which can be used together to create compelling and private on-device experiences.