memory issue
Asked on 2025-03-03
2 searches
It seems like you're interested in memory issues discussed at Apple's WWDC. The session titled "Analyze heap memory" covers various aspects of memory management, including tools for inspecting heap memory issues, transient and persistent memory growth, and managing autorelease pool growth in Swift.
For example, the session discusses how to use Xcode's memory graph debugger and other tools like leaks, heap, VMMAP, and Malloc history to analyze memory issues. It also covers the impact of transient memory growth, such as memory spikes, and how they can cause memory pressure and potentially lead to app termination.
If you're interested in a specific topic, such as managing autorelease pool growth in Swift, you can check out the chapter on Managing autorelease pool growth in Swift.
For more detailed insights, you might want to explore the session chapters like "Tools for inspecting heap memory issues" or "Persistent memory growth overview" to understand how to address specific memory challenges in your applications.

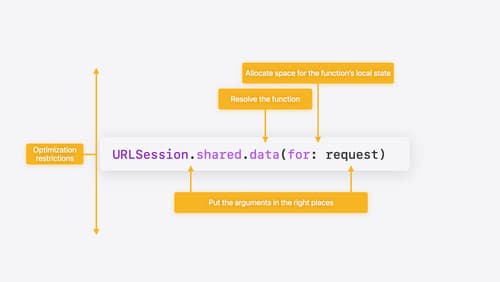
Explore Swift performance
Discover how Swift balances abstraction and performance. Learn what elements of performance to consider and how the Swift optimizer affects them. Explore the different features of Swift and how they’re implemented to further understand the tradeoffs available that can impact performance.

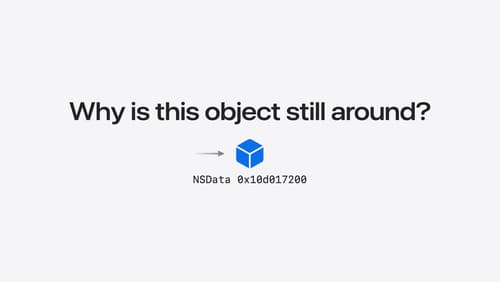
Analyze heap memory
Dive into the basis for your app’s dynamic memory: the heap! Explore how to use Instruments and Xcode to measure, analyze, and fix common heap issues. We’ll also cover some techniques and best practices for diagnosing transient growth, persistent growth, and leaks in your app.
