app crash
Asked on 2025-03-05
1 search

If you're dealing with an app crash, the session titled "Run, Break, Inspect: Explore effective debugging in LLDB" from WWDC 2024 provides valuable insights into debugging crashes using LLDB. This session covers how to handle crash logs, set breakpoints, and use backtraces to understand the control flow leading to a crash.
For instance, you can open a crash log in Xcode, which uses LLDB to create a debugging session with the state of the program at the time of the crash. This allows you to investigate the source of the crash by examining the highlighted line of code and using backtraces to understand the sequence of function calls that led to the crash. You can find more about this in the chapter on "Crashlogs & starting the program" in the session.
Additionally, the session "Xcode essentials" discusses setting breakpoints effectively, which can be crucial in stopping the app at the point of error to inspect the state of the program. This can be particularly useful if your app is regularly throwing and catching expected errors.
For more detailed guidance, you can refer to the following chapters:
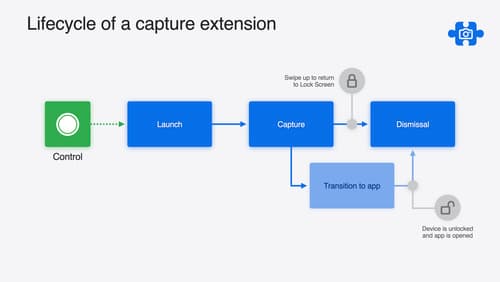
Build a great Lock Screen camera capture experience
Find out how the LockedCameraCapture API can help you bring your capture application’s most useful information directly to the Lock Screen. Examine the API’s features and functionality, learn how to get started creating a capture extension, and find out how that extension behaves when the device is locked.

Analyze heap memory
Dive into the basis for your app’s dynamic memory: the heap! Explore how to use Instruments and Xcode to measure, analyze, and fix common heap issues. We’ll also cover some techniques and best practices for diagnosing transient growth, persistent growth, and leaks in your app.
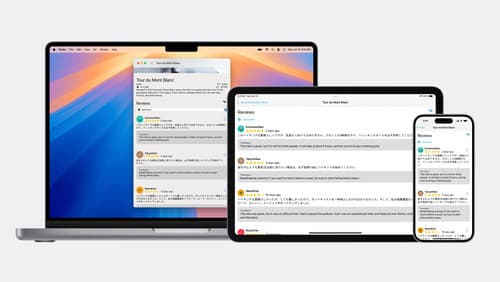
Meet the Translation API
Discover how you can translate text across different languages in your app using the new Translation framework. We’ll show you how to quickly display translations in the system UI, and how to translate larger batches of text for your app’s UI.