how to inspect and solve a fluency problem
Asked on 2025-03-06
2 searches

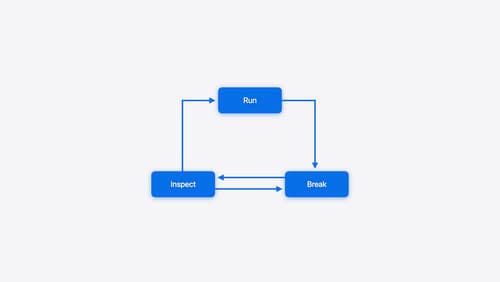
To inspect and solve a fluency problem in your code, you can utilize effective debugging techniques as discussed in the session "Run, Break, Inspect: Explore effective debugging in LLDB" from WWDC 2024. Here are some steps you can follow:
-
Reproduce the Bug: The first step in debugging is to reproduce the bug. This might involve running the application under a debugger like LLDB or using crash logs to understand the state of the program at the time of the crash.
-
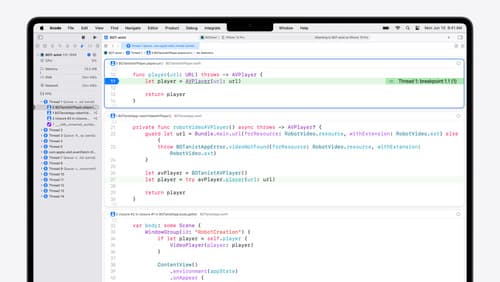
Use Breakpoints: Set breakpoints at strategic points in your code to pause execution and inspect the program state. This can help you identify where things are going wrong. You can set breakpoints before a suspected faulty function or use high-firing breakpoints to catch errors in frequently executed code.
-
Inspect Variables: Use the
pcommand in LLDB to inspect variables and evaluate expressions. This command has been enhanced to save time by combining multiple tools under a single command. -
Analyze Logs: If your codebase uses logging, analyze the logs to trace the program's execution path and identify where the problem might be occurring.
-
Use Swift Error Breakpoints: If you suspect a Swift error is causing the issue, you can set a Swift error breakpoint to stop the application as soon as an error is thrown.
-
Iterate: Debugging is often an iterative process. You may need to run, break, and inspect multiple times, adjusting your approach based on what you discover.
For more detailed guidance, you can refer to the session Run, Break, Inspect: Explore effective debugging in LLDB (00:01:02) which covers these techniques in depth.
Run, Break, Inspect: Explore effective debugging in LLDB
Learn how to use LLDB to explore and debug codebases. We’ll show you how to make the most of crashlogs and backtraces, and how to supercharge breakpoints with actions and complex stop conditions. We’ll also explore how the “p” command and the latest features in Swift 6 can enhance your debugging experience.
What’s new in Xcode 16
Discover the latest productivity and performance improvements in Xcode 16. Learn about enhancements to code completion, diagnostics, and Xcode Previews. Find out more about updates in builds and explore improvements in debugging and Instruments.
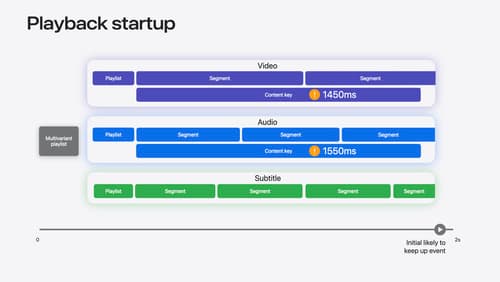
Discover media performance metrics in AVFoundation
Discover how you can monitor, analyze, and improve user experience with the new media performance APIs. Explore how to monitor AVPlayer performance for HLS assets using different AVMetricEvents, and learn how to use these metrics to understand and triage player performance issues.