how to improve network performance
Asked on 2025-03-10
1 search

To improve network performance, you can consider several strategies and tools discussed in various WWDC sessions:
-
Profiling and Optimization: Use profiling tools to identify bottlenecks in your network operations. For instance, in the session "Deploy machine learning and AI models on-device with Core ML," it is suggested to use performance reports to identify bottlenecks by sorting operations based on their estimated time. This can help in optimizing the network by addressing the most time-consuming operations.
-
Memory Management: Efficient memory management can indirectly improve network performance by reducing overhead. The session "Analyze heap memory" discusses strategies like enabling whole module optimization, profiling for expensive struct copies, and minimizing the use of reference types. These practices can help in reducing memory-related performance issues.
-
Swift Performance: The session "Explore Swift performance" emphasizes the importance of algorithmic improvements and low-level performance optimizations. By improving the efficiency of your code, you can enhance overall application performance, including network operations.
-
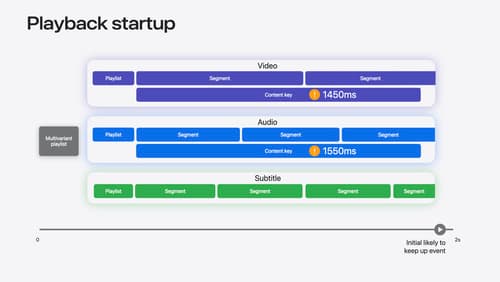
Media Performance Metrics: In the session "Discover media performance metrics in AVFoundation," it is suggested to use client-side metrics to triage issues in the field. Monitoring key performance indicators (KPIs) can help in identifying and addressing network-related issues.
For more detailed insights, you might want to explore specific chapters from these sessions:
- Analyze heap memory (Reducing reference counting overhead)
- Explore Swift performance (What is performance?)
- Discover media performance metrics in AVFoundation (Media performance metrics)
These resources provide a comprehensive approach to improving network performance by focusing on profiling, memory management, and performance metrics.
Discover media performance metrics in AVFoundation
Discover how you can monitor, analyze, and improve user experience with the new media performance APIs. Explore how to monitor AVPlayer performance for HLS assets using different AVMetricEvents, and learn how to use these metrics to understand and triage player performance issues.

Analyze heap memory
Dive into the basis for your app’s dynamic memory: the heap! Explore how to use Instruments and Xcode to measure, analyze, and fix common heap issues. We’ll also cover some techniques and best practices for diagnosing transient growth, persistent growth, and leaks in your app.
Bring your machine learning and AI models to Apple silicon
Learn how to optimize your machine learning and AI models to leverage the power of Apple silicon. Review model conversion workflows to prepare your models for on-device deployment. Understand model compression techniques that are compatible with Apple silicon, and at what stages in your model deployment workflow you can apply them. We’ll also explore the tradeoffs between storage size, latency, power usage and accuracy.