如何排查 hangups
Asked on 2025-04-01
1 search
To troubleshoot hangups in your app, you can use several tools and techniques presented at WWDC:
-
Instruments in Xcode: The Time Profiler instrument is a powerful tool to diagnose performance problems, such as hangups during app launch. It visualizes CPU usage and helps measure how long different parts of your code take to execute. You can set the inspection range to the hang interval and use the flame graph for a high-level overview of trace execution. This can help you identify and narrow down the problem areas. For more details, you can refer to the session What’s new in Xcode 16.
-
Heap Memory Analysis: Sometimes, hangups can be related to memory issues. Using Xcode's memory graph debugger and Instruments to analyze heap memory can help identify patterns of transient and persistent growth that might cause stutters or hangs. For more information, see the session Analyze heap memory.
-
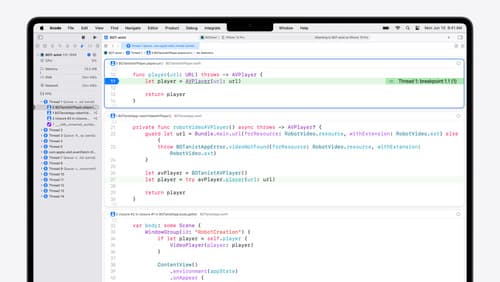
Debugging Techniques: Effective debugging can also help identify the root cause of hangups. Using breakpoints strategically, such as setting them in tandem or using conditions, can help isolate problematic code. The session Xcode essentials provides insights into debugging techniques.
-
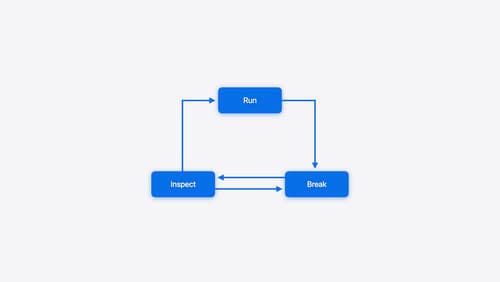
LLDB Debugger: The LLDB debugger can be used to inspect program state and identify where the program might be hanging. It allows you to interact with the program at different points in time to find faulty code. For more on this, refer to the session Run, Break, Inspect: Explore effective debugging in LLDB.
These tools and techniques can help you effectively diagnose and resolve hangups in your app.

Run, Break, Inspect: Explore effective debugging in LLDB
Learn how to use LLDB to explore and debug codebases. We’ll show you how to make the most of crashlogs and backtraces, and how to supercharge breakpoints with actions and complex stop conditions. We’ll also explore how the “p” command and the latest features in Swift 6 can enhance your debugging experience.

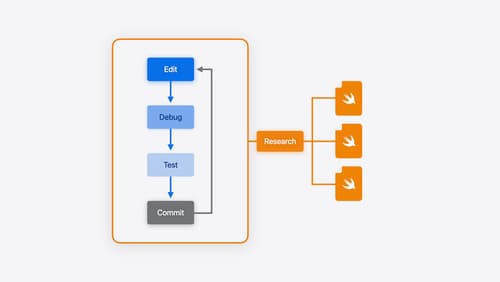
Xcode essentials
Edit, debug, commit, repeat. Explore the suite of tools in Xcode that help you iterate quickly when developing apps. Discover tips and tricks to help optimize and boost your development workflow.

What’s new in Xcode 16
Discover the latest productivity and performance improvements in Xcode 16. Learn about enhancements to code completion, diagnostics, and Xcode Previews. Find out more about updates in builds and explore improvements in debugging and Instruments.
