call frame
Asked on 2025-04-09
2 searches

The concept of a "call frame" is discussed in the session titled "Explore Swift performance" at WWDC 2024. A call frame is essentially the memory allocated for a function to execute, and it is traditionally allocated on the stack. This allocation is done by subtracting from the stack pointer at the start of the function, and deallocating by adding back to the stack pointer before the function returns. The call frame can be thought of as having a layout similar to a C struct, where the local state of the function becomes fields in the call frame. This is considered ideal because the compiler always emits the necessary instructions to allocate this space, making it an efficient way to manage memory for function execution.
For more details, you can refer to the session Explore Swift performance (07:38).
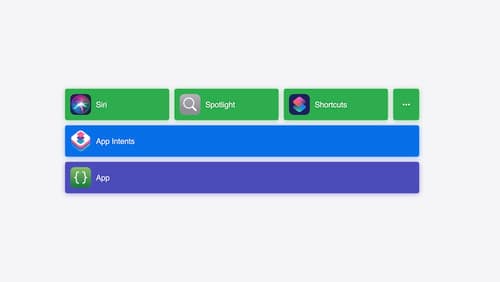
Bring your app’s core features to users with App Intents
Learn the principles of the App Intents framework, like intents, entities, and queries, and how you can harness them to expose your app’s most important functionality right where people need it most. Find out how to build deep integration between your app and the many system features built on top of App Intents, including Siri, controls and widgets, Apple Pencil, Shortcuts, the Action button, and more. Get tips on how to build your App Intents integrations efficiently to create the best experiences in every surface while still sharing code and core functionality.

Render Metal with passthrough in visionOS
Get ready to extend your Metal experiences for visionOS. Learn best practices for integrating your rendered content with people’s physical environments with passthrough. Find out how to position rendered content to match the physical world, reduce latency with trackable anchor prediction, and more.
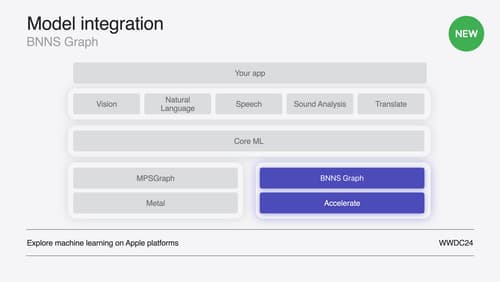
Support real-time ML inference on the CPU
Discover how you can use BNNSGraph to accelerate the execution of your machine learning model on the CPU. We will show you how to use BNNSGraph to compile and execute a machine learning model on the CPU and share how it provides real-time guarantees such as no runtime memory allocation and single-threaded running for audio or signal processing models.